Gallery
Primary tabs
Planning the Next GGH

Related:

Related:

Related:

Related:

Related:

Related:
Map 23: Other Wholesaling Archetype Employment, G...

Related:
Map 20: Higher Education Employment Change, GGH,...

Related:
Map 28: Telecoms – Special Archetype Employment C...

Related:
Map 29: Pharma – Special Archetype Employment, GG...

Related:
Map 30: Pharma – Special Archetype Employment Cha...

Related:
Map 31: Other Manufacturing Archetype Employment,...

Related:
Map 32: Other Manufacturing Archetype Employment...

Related:
Map 33: Employment in Industries with Highest Vul...

Related:
Map 34: Employment in Industries with Highest Vuln...

Related:
Map 35: Employment in Industries with Highest Vul...

Related:
Map 27: Telecoms – Special Archetype Employment,...

Related:
Map 1: Core Employment, GGH, 2016

Related:
Map 2: Core Employment Change, GGH, 2006-2016

Related:
Map 3: Core Employment, GGH with Megazones and SKI...

Related:
Map 4: Core Employment Change, GGH with Megazones...

Related:
Map 5: Finance Archetype Employment, GGH, 2016

Related:
Map 6: Finance Archetype Employment Change, GGH,...

Related:
Map 7: High Order Business Services Archetype Emp...

Related:
Map 8: High Order Business Services Archetype Emp...

Related:
Map 9: Back Office Archetype Employment, GGH, 201...

Related:
Map 10: Back Office Archetype Employment Change,...

Related:
Map 11: Arts and Design-Related Archetype Employm...

Related:
Map 12: Arts and Design-Related Archetype Employm...

Related:
Map 13: Soft Tech Archetype Employment, GGH, 2016

Related:
Map 14: Soft Tech Archetype Employment Change, GG...

Related:
Map 15: Hard Tech Archetype Employment, GGH, 2016

Related:
Map 16: Hard Tech Archetype Employment Change, GG...

Related:
Map 17: Science-Based Archetype Employment, GGH,...

Related:
Map 18: Science-Based Archetype Employment Change...

Related:
Map 19: Higher Education Archetype Employment, GG...

Related:
Map 21: Logistics Archetype Employment, GGH, 2016

Related:
Map 22: Logistics Archetype Employment Change, GG...

Related:
Map 24: Other Wholesaling Archetype Employment Ch...

Related:
Map 25: Aerospace – Special Archetype Employment,...

Related:
Map 26: Aerospace – Special Archetype Employment...

Related:

Related:

Related:

Related:
Figure 7: Settlements by source of water

Related:
Figure 8: Settlements by receiving waterbody for w...

Related:
Figure 5: Potential linkages for wastewater data s...

Related:
Figure 4: Potential linkages for water data source...

Related:
Figure 3: Matrix for evaluating data sources

Related:
Figure 6: Types of water systems in Ontario

Related:
Figure 2: Data fields for understanding wastewater...

Related:
Figure 1: Data fields for understanding water capa...

Related:

Related:

Related:

Related:

Related:

Related:

Related:

Related:

Related:

Related:

Related:

Related:

Related:

Related:

Related:

Related:

Related:

Related:

Related:

Related:

Related:

Related:

Related:

Related:

Related:

Related:

Related:

Related:
GTHA Land Supply 2016

Related:
Brampton Development Application Selection

Related:
Brampton Serviced Land Supply

Related:

Related:

Related:

Related:

Related:
Related:

Related:

Related:
AMZ

Related:
AMZ

Related:
Unlocking the Potential of the Airport Megazone

Related:
AMZ - Executive Summary - 2

Related:
AMZ - Executive Summary - 1

Related:
AMZ - Executive Summary - 3

Related:
AMZ - Travel, Transportation Patterns, and Transit...

Related:
AMZ - Travel, Transportation Patterns, and Transit...

Related:
AMZ - Travel, Transportation Patterns, and Transit...

Related:
AMZ - Economic Assets - 1

Related:
AMZ - Development Potential - 1

Related:
AMZ - Development Potential - 2

Related:
AMZ - The employment geography of the megazone - 1

Related:
AMZ - The employment geography of the megazone - 2

Related:

Related:
AMZ - Employment Change - 1

Related:
AMZ - Types of Employment - 1

Related:
AMZ - Types of Employment - 2

Related:
AMZ - Types of Employment - 3

Related:
AMZ - The Basics - 2

Related:
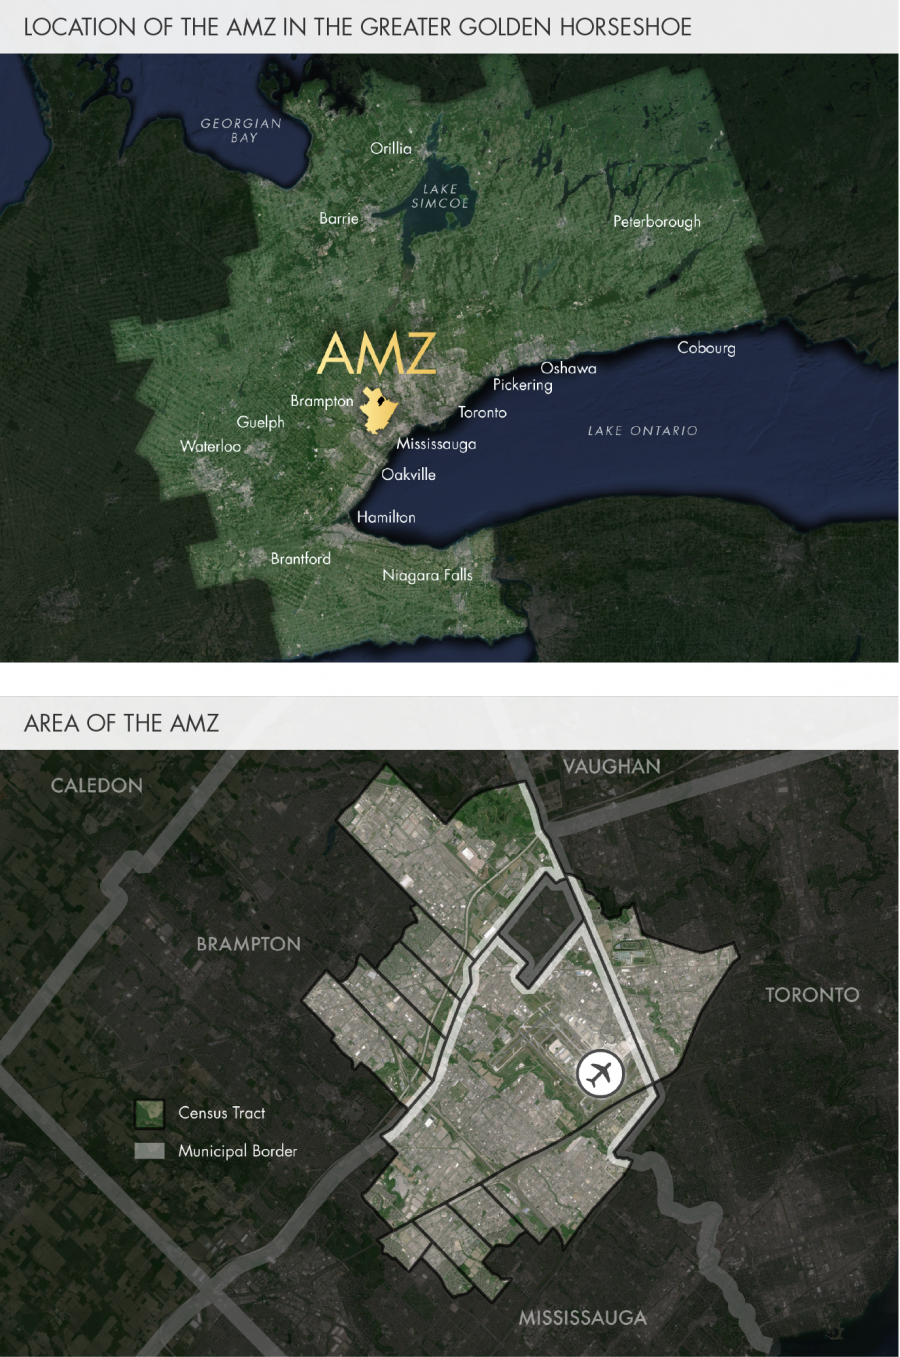
AMZ Location
Related:
Land Supply GTHA 2016

Related:
The extent of urbanization of the DGA in the GTHA...

Related:
Marcy Burchfield

Related:
AMZ Figure 1

Related:

Related:
Calculating designated greenfield area density

Related:
Calculating greenfield area density

Related:
SCN

Related:
Sustainable City Network Logo

Related:
Neptis Geoweb Logo

Related:
Neptis Geoweb Logo

Related:
% Attached (semis and rowhouses)
")
Related:
% Single-Detached

Related:
% Apartments and Duplexes

Related:
% Apartments and Duplexes

Related:
Housing Type Mix and Average Household Size of Stu...

Related:
Street Patterns in Different Areas

Related:
Study Area Street Networks

Related:
External Connectivity (average distance in metres...
")
Related:
Road Density (total road length in metres per deve...
")
Related:
Intersection Density (intersections per developabl...
")
Related:
Intersection Frequency (intersections per road kil...
")
Related:
Number of Jobs per 400 Hectares (gross land base)
")
Related:
Employment Land as % of Developable Land Area

Related:
Developable Area Employment Density (jobs per hect...
")
Related:
The Contribution of Jobs Density to Combined Popul...

Related:
Combined Public Transit (local and regional) and s...
Related:
Motorized (automobile, taxi, and motorcycle) mode...
 mode share for journeys to work, school and childcare, and shopping")
Related:
Non-Motorized (walking and cycling) mode share for...
 mode share for journeys to work, school and childcare, and shopping")
Related:
Relating Motorized Non-Motorized Share to Neighbou...

Related:
Relating Motorized Mode Share to Neighbourhood Acc...

Related:
Work Journeys to Scarborough Town Centre

Related:
David Quarmby, Designer and Former Board Member of...

Related:
Neptis staff participate in GIS Day at Ryerson Uni...

Related:
Neptis staff participate in GIS Day at Ryerson Uni...

Related:
Neptis staff participate in GIS Day at Ryerson Uni...

Related:
Greater Toronto Area

Related:
Star Map Marcy Quote

Related:
Toronto Region - Land Supply Question

Related:
The Greater Toronto and Hamilton Area

Related:
Metro Vancouver

Related:
Toronto Area, Expansion Area

Related:
Toronto Area, Expansion Area

Related:
Toronto Area, Existing Urban Area

Related:
Toronto Area, Existing Urban Area

Related:
Toronto Area, City Region

Related:
Urban Footprints and Urban Form Measurements

Related:
Greater Toronto and Hamilton Area and Metro Vancou...

Related:
Toronto, Vancouver Urban Area

Related:
Toronto Area, Regional Findings, 1991 - 2011

Related:
Vancouver City Region

Related:
Vancouver City Region

Related:
Vancouver Existing Urban Area

Related:
Vancouver Existing Urban Area

Related:
Vancouver Expansion Area

Related:
Vancouver Expansion Area

Related:
Metro Vancouver

Related:
The Greater Toronto and Hamilton Area

Related:
Intensification Area, GTHA

Related:
Regional Findings, Toronto Area 1991 - 2011

Related:
Regional Findings, Toronto Area 1991 - 2011

Related:
Greater Toronto and Hamilton Area and Metro Vancou...

Related:
Greater Toronto and Hamilton Area and Metro Vancou...

Related:
Marcy Burchfield on the Agenda January 2016

Related:
M Burchfield on the Agenda January 2016

Related:
Greenfield Areas Urbanized, GTHA, 2001 -2011

Related:
Intensification Area, GTHA

Related:
Urban Footprints and Urban Form Measurements

Related:
Regional Findings, Vancouver. 1991-2011

Related:
Regional Findings, Vancouver. 1991-2011

Related:
Intensification Area, Metro Vancouver

Related:
Greenfield Areas Urbanized, Metro Vancouver, 2001-...

Related:
Greenfield Areas Urbanized, Metro Vancouver, 2001-...

Related:
Figure 4: Employment categories used in the analys...

Related:
Figure 1: Manufacturing Employment as a Share of T...

Related:
Figure 3: Employment by Skill Level, GGH, 2001 and...
")
Related:
Figure 2: Change in Employment by Skill Level, GGH...
")
Related:
Map 3: Employment change in finance, 2001–2011

Related:
Map 5: Employment in manufacturing, 2011

Related:
Map 4: Employment in finance, 2011

Related:
Map 1: STEM Employment 2011

Related:
Map 2: STEM Employment change, 2001–2011

Related:
Map 6: Employment change in manufacturing, 2001–20...

Related:
Map 7: Change in core employment 2001–2011

Related:
Map 8: Core employment, 2011

Related:
Map 11: Warehousing and Transportation Employment,...

Related:
Map 13: Core Employment and the UGCs, 2011

Related:
Map 12: Spatial Economic Structure of the GGH and...

Related:
Map 9: Economic structure of the GGH

Related:
Map 10: Industrial employment 2011

Related:
Map 15: Core employment change 2006-2011, and empl...

Related:
Map 14: Employment change and the UGCs

Related:
MAP NO. A1 EMPLOYMENT IN AUTO MANUFACTURING, 2011

Related:
MAP NO. A2 EMPLOYMENT IN ICT MANUFACTURING, 2011

Related:
MAP NO. A6 HIGHER EDUCATION AND HOSPITALS, 2011

Related:
MAP NO. A5 GOVERNMENT AND VOLUNTARY SECTOR, 2011

Related:
MAP NO. A4 FINANCE AND BUSINESS SERVICES, 2011

Related:
MAP NO. A3 EMPLOYMENT IN ICT SERVICES, 2011

Related:
MAP NO. A10 CORE EMPLOYMENT, 2001

Related:
MAP NO. A9 POPULATION–RELATED EMPLOYMENT, 2011

Related:
MAP NO. A8 SPECIALIZED EMPLOYMENT (STUDIOS AND LAB...
, 2011")
Related:
MAP NO. A7 CULTURE AND TOURISM, 2011

Related:
MAP NO. A11 CORE EMPLOYMENT, 2006

Related:
MAP NO. A12 Airport Megazone, census tract selecti...

Related:
MAP NO. A13 Tor-York West Megazone, census tract s...

Related:
MAP NO. A14 Tor-York East Megazone, census tract s...

Related:
MAP NO. A18 Airport South SKID, census tract selec...

Related:
MAP NO. A17 heridan SKID, census tract selection

Related:
MAP NO. A16 Meadowvale SKID, census tract selectio...

Related:
MAP NO. A15 Waterloo SKID, census tract selection

Related:
Map 7: Change in core employment 2001–2011

Related:
Map 8: Core employment, 2011

Related:
Map 13: Core Employment and the UGCs, 2011

Related:
MAP NO. A19 Markham SKID, census tract selection

Related:
Map 4: Employment in finance, 2011

Related:
Map 2: STEM Employment change, 2001–2011

Related:
Map 1: STEM Employment 2011

Related:
Map 10: Industrial employment 2011

Related:
Map 15: Core employment change 2006-2011, and empl...

Related:
Map 3: Employment change in finance, 2001–2011

Related:
Map 5: Employment in manufacturing, 2011

Related:
Map 6: Employment change in manufacturing, 2001–20...

Related:
Figure 1: Manufacturing Employment as a Share of T...

Related:
Map 11: Warehousing and Transportation Employment,...

Related:
Map 14: Employment change and the UGCs

Related:
Figure 2: Change in Employment by Skill Level, GGH...
")
Related:
Figure 3: Employment by Skill Level, GGH, 2001 and...
")
Related:
Figure 4: Change in GGH Employment 2001–2014, Tota...
")
Related:
Figure 5: Change in GGH Employment, 2001–2014, Tot...
")
Related:
Figure 6: Change in GGH Employment 2001–2014, Tota...
")
Related:
Map 12: Spatial Economic Structure of the GGH and...

Related:
Map 12 Spatial Economic Structure of the GGH and t...

Related:
Map 9 Economic structure of the GGH

Related:
Map 9 Spatial Economic Structure of the GGH, 2011

Related:
Map A4 Finance and Business Services, 2011

Related:
Map 7 Change in Core Employment, 2001-2011

Related:
Map A15 Waterloo SKID, Census Tract Selection

Related:
Map A9 Population-Related Employment, 2011

Related:
Map A8 Specialized Employment (Studios and Labs),...
, 2011")
Related:
Map A14 Tor-York East Megazone, Census Tract Selec...

Related:
Map A11 Core Employment

Related:
Map A19 Markham SKID, Census Tract Selection

Related:
Map A18 Airport South SKID, Census Tract Selection

Related:
Geo Rail Regional Rail, Existing and Proposed Rout...

Related:
Map A5 Government and Voluntary Sector, 2011

Related:
Map A6 Higher Education and Hospitals, 2011

Related:
Map 2 Change in STEM Employment, 2001 -2011

Related:
Map 1 STEM Employment

Related:
Map A13 Tor-York West Megazone, Census Tract Selec...

Related:
Map A12 Airport Megazone, Census Tract Selection

Related:
Population Gain and Loss in Established Urban Area...

Related:
Pamela Blais

Related:
Pamela Blais

Related:
Marcy Burchfield on the Agenda

Related:
Composition of dwelling stock, GTHA and Metro Vanc...

Related:
Proportion of dwelling units accommodated through...

Related:
Net gain in population and dwellings, GTHA, 2001–2...

Related:
Composition of dwelling stock added in greenfield...

Related:
Composition of dwelling stock added through intens...

Related:
Composition of dwelling stock added in greenfield...

Related:
Composition of Dwelling Stock added through Intens...

Related:
Net gain in population and dwellings, Metro Vancou...

Related:
Metropolitan Indicators Poster

Related:
Work Journeys to Downtown Toronto

Related:
David Quarmby, Designer and Former Board Member of...

Related:
Neptis staff participate in GIS Day at Ryerson Uni...

Related:
Metrolinx Review

Related:
Why Presto Isn't Yet an Oyster

Related:
Delegation from Ningbo, China Visits Neptis

Related:
Why Presto Isn't Yet an Oyster

Related:
Understanding the implications of land budgets

Related:
The Issues Papers: Smart Growth Panel

Related:
Four Canadian Urban Regions

Related:
Downzoning in Markham

Related:
Understanding the Growth Plan's greenfield density...

Related:
20 years of population and land growth (1991-2011)
")
Related:
Housing Diversity- Vancouver v Toronto (1991-2011)
")
Related:
Metropolitan Indicators Poster

Related:
The Issues Papers; Smart Growth Panel

Related:
Population Growth vs Designated Land

Related:
Future projections of population versus land

Related:
Implementation of Growth Plan targets (Minimums ve...
")
Related:
Summary of Measurements: Scale of Analysis

Related:
Figure 3: Testing the Impact of Different Growth O...

Related:
Intensification Rates in the Greater Golden Horses...

Related:
Monthly wholesale natural gas prices

Related:
Per capita end use of energy by sector in Ontario...

Related:
The Growth Plan Purpose

Related:
Goals of the Growth Plan

Related:
Main policies of the Growth Plan

Related:
Population Growth vs Designated Land

Related:
Review of the Big Move: Benefits Case Analyses

Related:
Four Canadian Urban Regions

Related:
Main Geoweb

Related:
Four Canadian urban region: Vancouver, Edmonton, C...

Related:
Four Canadian Urban Regions

Related:
The Four Regions

Related:
Slow land consumption at urban edge: Vancouver, E...

Related:
How have Vancouver, Edmonton, Calgary, and Toronto...

Related:
% Population Increase vs % Urban Land Area Increas...

Related:
How Four Canadian Urban Regions Have Grown

Related:
Toronto: Canada's largest urban footprint

Related:
Toronto: Canada's Largest Urban Footprint

Related:
Allocation of population growth by upper-tier muni...

Related:
Inching Towards Sustainability

Related:
Work Journeys to Downtown Toronto

Related:
Toronto-Related Region Futures Study

Related:
Toronto-Related Region Futures Study

Related:
Places to Grow and the Big Move: View from the Net...

Related:
Toronto Region in 2031

Related:
Toronto Region

Related:
Urban Land Supply to 2031 in the Greater Toronto a...

Related:
Urban Growth Centres

Related:
The Greater Golden Horseshoe

Related:
Work Journeys to Scarborough Town Centre

Related:
Outward rings of urban growth, 1971–2004

Related:
The Urban Fringe in the GTA and Hamilton

Related:
Regional Municipality of Durham showing identified...

Related:
Natural Heritage System from the Greenbelt Draft P...

Related:
Development Pressure in Simcoe County

Related:
Components of the Greenbelt in the Toronto Metropo...

Related:
Effective and ineffective residential intensificat...

Related:
Intensification rates in the Greater Golden Horses...

Related:
An example of rural settlements in Hamilton, Onta...

Related:
Southern Ontario

Related:
Southern Ontario
Related:
Rapid Transit in Toronto

Related:
Understanding the Fundamentals of the Growth Plan

Related:
Growing Pains - STEP 4: IDENTIFY AREAS WITHIN WALK...

Related:
Growing Pains - STEP 3: RECONCILE GEOMETRIES IN TH...

Related:
Growing Pains - STEP 2: OVERLAY CENSUS DATA

Related:
Growing Pains - FREQUENT TRANSIT NETWORK IN THE GT...

Related:
Growing Pains - FREQUENT TRANSIT NETWORK IN METRO...

Related:
Growing Pains - STEP 1: MAP URBAN EXPANSION

Related:
Growing Pains - STEP 6: IDENTIFY AREAS AROUND GO S...

Related:
Growing Pains - STEP 5: IDENTIFY AREAS IN DESIGNAT...

Related:
Growing Pains - URBAN GROWTH CENTRES IN THE GTHA

Related:
Growing Pains - URBAN CENTRES IN METRO VANCOUVER

Related:
Growing Pains - STEP 1: MAP URBAN EXPANSION

Related:
Growing Pains - STEP 2: OVERLAY CENSUS DATA

Related:
Growing Pains - STEP 6: IDENTIFY AREAS AROUND GO S...

Related:
Growing Pains - STEP 5: IDENTIFY AREAS IN DESIGNAT...

Related:
Growing Pains - STEP 4: IDENTIFY AREAS WITHIN WALK...

Related:
Growing Pains - STEP 3: RECONCILE GEOMETRIES IN TH...

Related:
Population Gain and Loss in established urban area...

Related:
Dwellings added through intensification, GTHA, 200...

Related:
Population Gain and Loss in established urban area...

Related:
Greater Toronto and Hamilton Area and Metro Vancou...

Related:
Dwellings added through intensification, Metro Van...

Related:
Growing Pains - Metro Vancouver Region

Related:
Growing Pains - Greater Toronto and Hamilton Area

Related:
Net gain in population and dwellings, GTHA, 2001–2...

Related:
Proportion of dwelling units accommodated through...

Related:
Composition of dwelling stock, GTHA and Metro Vanc...
")
Related:
Composition of dwelling stock added in greenfield...

Related:
Composition of dwelling stock added through intens...

Related:
Net gain in population and dwellings, Metro Vancou...

Related:
Growing Pains - City Region

Related:
Net Population Change in the GTHA

Related:
Composition of dwelling stock added in greenfield...

Related:
Composition of dwelling stock added in greenfield...

Related:
Net Population Change in the GTHA

Related:
Population Gain and Loss in established urban area...

Related:
Population Gain and Loss in established urban area...

Related:
Population Gain and Loss in established urban area...

Related:
Growing Pains - Toronto vs. Vancouver

Related:
Elevated rail is faster, more cost effective and t...

Related:
Growing Pains - Metro Vancouver Region

Related:
Growing Pains - Greater Toronto and Hamilton Area

Related:
Prospects for Agriculture in the Toronto Region

Related:
What Vancouver can teach Toronto about urban smart...

Related:
Growing Pains - Toronto Population Change
Related:
Growing Pains, Toronto vs. Vancouver
Related:
Travel and Housing Costs

Related:
Growing Pains Net Population
Related:
Growing Pains

Related:
Toronto-related Futures Study

Related:
Evolving Physical Condition of the GTA

Related:
A Methodology for Estimating the Historical Rate o...

Related:
Travel in the GTA

Related:
Prospects for Agriculture in the Toronto Region

Related:
Municipal Finance and Governance in the GTA

Related:
People and Places

Related:
A Region in Transition
Related:

Related:

Related:
Photo from Toronto Star, Marcy quote
Related:
David Quarmby interviewed on CBC Evening News

Related:
David Quarmby

Related:
Go Rail Regional Express Rail

Related:
Toronto Satellite Image

Related:
The map summarizes transit projects currently fund...

Related:
Hudson Yards projects

Related:
Hudson Yards projects

Related:
Hudson Yards projects

Related:
Marcy Burchfield speaks at the Ontario Farmland Tr...

Related:
Marcy Burchfield speaks at the Ontario Farmland Tr...

Related:
Neptis staff participate in GIS Day at Ryerson Uni...

Related:
Toronto Projected Growth

Related:
Marcy Burchfield participates in a discussion on t...

Related:
Marcy Burchfield participates in a discussion on t...

Related:
Marcy Burchfield speaks on “The Growth Plan: what’...

Related:
Neptis hosts a delegation from Ningbo, China

Related:
Visualizing Urban Futures: Geomatics Decision Supp...

Related:
The Big Move

Related:
Existing and Proposed GO Rail Routes

Related:
Markham, Ontario

Related:
GO vs. EMU

Related:
Oyster Card (Tfl) and the Presto Card (Metrolinx)

Related:
Transit-oriented development with a mix of uses bu...

Related:
On the high streets, building heights increased, f...

Related:
Low-rise residential buildings commonplace in Chic...

Related:
Public art has always been an important part of th...

Related:
Oak Park features a variety of architectural desig...

Related:
Scheme 1 Rapid Transit System: Preferred Scheme Fr...

Related:
Plan Showing Recommended Radial Railway Entrances,...

Related:
Integrated regional transit

Related:
Neptis GeoWeb

Related:
Toronto: Canada's largest urban footprint

Related:
The Greater Golden Horseshoe

Related:
Images of Sprawl: greenfield development

Related:
Images of sprawl: parking lots

Related:
Vancouver SkyTrain

Related:
David Quarmby in Toronto with Christopher Hume and...

Related:
The Big Move, Metrolinx

Related:
Transit, Planning, Governance, and Politics

Related:
London's Oyster card

Related:
Prime agricultural lands

Related:
A slice of Peel Region

Related:
Traffic Congestion in the GTA And Hamilton

Related:
The Urban Fringe in the GTA and Hamilton

Related:
Slice of Simcoe

Related:
Sydney’s Greater Metropolitan Region

Related:
Detailed map of the MTARTS Parkway Belt

Related:
Summary graphic: Proposed schemes by Metrolinx and...

Related:
Integrate the Built Boundary with the Urban Settle...

Related:
Classify remaining Settlement Area Boundary expans...

Related:
Classify Designated Greenfield Areas

Related:
Identify Designated Greenfield Areas

Related:
Classify settlement areas as Urban or Rural.

Related:
Identify the Built Boundary: Built-Up Area for eac...

Related:
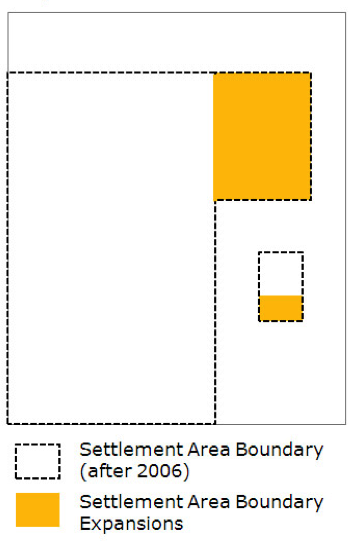
Settlement Area Boundary Expansions
Related:
Geoweb

Related:
25-Year Big Move Plan

Related:
15-Year Big Move Plan

Related:
25-Year Big Move Plan

Related:
Mobility Hubs

Related:
Mobility Hubs

Related:
Central Pickering Planning Area

Related:
Lake Simcoe Protection Plan Area and Built Up Area

Related:
Lake Simcoe Protection Plan Area

Related:
Oak Ridges Moraine Plan Area and Built Up Area

Related:
Oak Ridges Moraine Plan Area

Related:
Niagara Escarpment Plan Area and Built Up Area

Related:
Niagara Escarpment Plan Area

Related:
Protected Countryside and the Built Up Area in the...

Related:
Protected Countryside in the GGH

Related:
Greenbelt Plan Area and Built Up Area of the Great...

Related:
Greenbelt Plan Area includes the Niagara Escarpmen...

Related:
Welland Canal

Related:
International Airports in the GGH

Related:
International Airport in the GGH

Related:
Commuter Rail and Subways in the GGH

Related:
Commuter Rail in the GGH

Related:
Railways and Built Up Area in the GGH

Related:
Active railway lines in the GGH.

Related:
Subway and Built Up Area

Related:
Existing Toronto subway lines

Related:
Roads in Southern Ontario

Related:
Roads and Municipal Boundaries in the GGH

Related:
Roads in Southern Ontario

Related:
Watershed boundaries and Upper/ Single Tier Munipa...

Related:
Watershed boundaries in Southern Ontario

Related:
Rivers in Southern Ontario

Related:
Greenlands and Built Up Area in the GGH

Related:
Greenlands in South-Central Ontario

Related:
Built-up Area (1971)
")
Related:
Built-up Area from 1981, 1971

Related:
Built-up Area from 1991, 1981, 1971

Related:
Built-up Area from 1971

Related:
Built-up Area from 2001, 1991, 1981, 1971

Related:
Historical Regional Planning Jurisdictions

Related:
Historical Regional Planning Jurisdictions

Related:
Upper-Tier/Single-Tier/Lower Municipalities withi...

Related:
Lower tier municipalities

Related:
Upper-Tier/Single-Tier/Regional Municipalities

Related:
Built Up Area, Whitebelt lands and Greenbelt Plan

Related:
Whitebelt lands and Greenbelt Plan

Related:
Whitebelt lands

Related:
Holland Marsh, Greenbelt Plan and Built Up Area

Related:
Holland Marsh

Related:
Holland Marsh

Related:
Niagara Peninsula Grape and Tender Fruit Lands

Related:
Niagara Peninsula Grape and Tender Fruit Lands

Related:
Prime Agricultural Lands and the Built Up Area

Related:
Prime Agricultural Lands and the Greenbelt

Related:
Prime Agricultural Lands

Related:
Villages and Hamlets

Related:
Strategic Employment Areas and Greenbelt Plan

Related:
Strategic Employment Areas

Related:
Pickering Airport Lands and the Greenbelt

Related:
Pickering Airport Lands

Related:
Urban Growth Centres

Related:
Built Up and Urban Expansion Areas

Related:
Urban Expansion Area pre and post 2006

Related:
New Urban Expansion Area (2006–2031)
")
Related:
Built Up Area (2006), Urban Expansion Area (pre 20...
, Urban Expansion Area (pre 2006) and the Greenbelt Plan")
Related:
Urban Expansion Area (pre 2006)
")
Related:
Built Up Area (2006) and the Greenbelt Plan
 and the Greenbelt Plan")
Related:
Built-Up Urban Area (2006)
")
Related:
Built-Up Urban Area (2006)
")
Related:
NeptisGeoweb

Related:
Forecast Growth and Land Planned to be Urbanized,...

Related:
Amount of land designated for development, by sing...

Related:
Built boundary and settlement area boundary

Related:
Subway to Scarborough City Centre

Related:
Performance of the Richmond Hill Subway, Eglinton-...

Related:
Optimizing the Program

Related:
The Airtrain to New York’s JFK Airport

Related:
Vancouver's Skytrain

Related:
Proposed Scarborough “Y”

Related:
Fuel taxes, London UK

Related:
London Travel Report

Related:
Drawing from Metrolinx shows how the underground s...

Related:
Figure from Eglinton Crosstown BCA

Related:
Metrolinx’s cost estimates and proposed completion...

Related:
Scarborough RT and planned Eglinton Crosstown

Related:
The four “Transit City” LRT schemes included in Me...

Related:
Illustration from the TTC’s original Transit City...

Related:
Capital cost, net revenue, and new ridership for a...

Related:
Performance of subway and Transit City schemes

Related:
The current Metrolinx schemes will not deliver the...

Related:
Comparative Costs and Revenues of Different Modes

Related:
Graph prepared by Metrolinx to inform the debate o...

Related:
Metrolinx and TTC are now proposing to extend the...

Related:
The Big Move Map

Related:
Upgrading GO into a true regional rapid transit sy...

Related:
GO rail upgrading hardly figures in Metrolinx's “9...

Related:
The regional rail “S-Bahn” system in Zurich, Switz...

Related:
The rail system serving the greater Sydney region...

Related:
TTC’s Main Station is only 250 metres from GO’s Da...

Related:
GO’s system map identifies “TTC Connections” but d...

Related:
Plan showing proposed DRL and existing GO Rail and...

Related:
Average Annual Population Growth Rates, 1976-2001

Related:
Simcoe County – Natural Features

Related:
Simcoe County - Watersheds

Related:
Political Boundaries

Related:
Proposed Highway Network

Related:
Development in New Tecumseth

Related:
Bradford Bond Head Planning Area

Related:
Big Bay Point

Related:
Toronto Region – Commutershed

Related:
Summary Map: Simcoe County

Related:
Minimum intensification targets assigned to lower-...

Related:
1954 Metropolitan Toronto Planning Board

Related:
1954 Metropolitan Toronto Planning Board
Related:
1966 Metropolitan Plan for the Metropolitan Planni...

Related:
1966 Metropolitan Plan for the Metropolitan Planni...
Related:
1965 MTPB’s transportation plan
Related:
1967 Choices for a Growing Region

Related:
1974 Toronto Centered Region (TCR) Concept
 Concept")
Related:
TCR Concept and Parkway Belt

Related:
1990 Space for All: Options for a Greater Toronto...

Related:
Late 1980’s urbanization extent

Related:
2002 The Oak Ridges Moraine Conservation Plan

Related:
2006 Growth Plan for the Greater Golden Horseshoe

Related:
1943 Plan

Related:
1967 Choices for a Growing Region

Related:
1967 Choices for a Growing Region
Related:
1967 Choices for a Growing Region, MTARTS Parkway...

Related:
1967 Choices for a Growing Region, MTARTS Parkway...
Related:
Region-wide water supply system introduced in the...

Related:
Separated cities and use of alternative minimum de...

Related:
Minimum designated greenfield area density targets...

Related:
Comparison of land designated for growth, Inner an...

Related:
Land Supply for urban growth, by upper- and single...

Related:
Land designated for growth in the Greater Golden H...

Related:
Upper- and single-tier municipalities eligible to...

Related:
Comparison of land area designated as urban or rur...

Related:
Comparison between the BAU study area and the Grea...

Related:
Location of rural settlement areas

Related:
View of Toronto from 323 Richmond st.

Related:
Location of the Whitebelt lands

Related:
Location of land designated for growth in the Grea...

Related:
Historic and forecast population growth in the Gre...

Related:
Location of the Whitebelt lands

Related:
Location of the Whitebelt

Related:
Location of Urban Growth Centres

Related:
Adoption of minimum intensification targets by upp...

Related:
Adoption of minimum designated greenfield area den...

Related:
Status of single- and upper-tier municipal work to...

Related:
Upper-tier municipal approaches to for allocating...

Related:
Generalized Municipal Official Plan Review and Gro...

Related:
Examples of upper-tier municipal approaches to all...

Related:
Examples of upper-tier municipal options for alloc...

Related:
Calculating intensification

Related:
Distribution of population growth, 2001–2041, Oute...

Related:
Distribution of population, Outer Ring municipalit...

Related:
Distribution of population growth in the Greater G...

Related:
Distribution of population growth 2001–2041, Inner...

Related:
Distribution of population growth 2001–2041, Inner...

Related:
Forecast population and employment and growth in t...

Related:
Distribution of population in the Greater Golden H...

Related:
Distribution of population, Inner Ring municipalit...

Related:
Simcoe Sub-area

Related:
Inner Ring and Outer Ring single- and upper-tier m...

Related:
Municipal Growth Plan conformity planning process

Related:
Generalized land budget process

Related:
Anatomy of the region

Related:
Upper East Side, Toronto, Architects Alliance

Related:

Related:
The Study Area: Greenlands Protection

Related:
Locations of study sites in the Greater Golden Hor...

Related:
The location of intensification in Toronto

Related:
Historical Commentary

Related:
Tony Coombes

Related:
Drive-time zones around power centres: 1996–2006

Related:
Study area locations

Related:
Transportation Tomorrow Survey (TTS) Study Areas
 Study Areas")
Related:
Urban Form Analysis

Related:
Existing Capacity Analysis

Related:
Agricultural resources in the Central Ontario Zone

Related:
Built Environment Analysis: Downtown Kitchener

Related:
Compact vs. sprawl: Montreal and Atlanta

Related:
Measuring intensification rates

Related:
Zooming into Waterloo Region

Related:
Comparing two ways of defining the built boundary...

Related:
Intensification rates for upper-tier municipalitie...

Related:
The location of intensification, Greater Golden Ho...

Related:
The location of intensification, Greater Golden Ho...

Related:
Fifteen-year intensification rate, Greater Golden...

Related:
Fifteen-year intensification rate, Greater Golden...

Related:
Changing patterns of intensification, Peel Region,...

Related:
Intensification rates for the same time period, 20...

Related:
Greater Vancouver’s Growth Concentration Area and...

Related:
Growth and constraints on development: Vancouver

Related:
A3: Nosehill Park

Related:
Level of Protection: Dufferin

Related:
Level of Protection: Durham

Related:
Level of Protection: Halton

Related:
Level of Protection: Kawartha Lakes

Related:
Level of Protection: Niagara

Related:
Level of Protection: Northumberland

Related:
Level of Protection: Peel

Related:
Level of Protection: Peterborough

Related:
Level of Protection: Simcoe

Related:
Level of Protection: Toronto

Related:
Level of Protection: Wellington

Related:
Level of Protection: York

Related:
City of Hamilton

Related:
Regional Municipality of Halton

Related:
Regional Municipality of Peel

Related:
City of Toronto

Related:
Regional Municipality of York

Related:
Regional Municipality of Durham

Related:
Regional Municipality of Niagara

Related:
Regional Municipality of Niagara

Related:
Waterloo Greenland's Classification

Related:
Regional Municipality of Waterloo

Related:
County of Wellington

Related:
County of Dufferin

Related:
City of Kawartha Lakes

Related:
County of Northumberland

Related:
County of Peterborough

Related:
Trafalgar Moraine

Related:
Pickering – Richmond Hill Land Exchange

Related:
Oro Moraine

Related:
Greenlands in Greater Golden Horseshoe

Related:
Land base definitions

Related:
Scales of analysis

Related:
Density gradient of the Toronto census metropolita...

Related:
Dwellings by census period of construction

Related:
Land uses in the 16 study areas

Related:
Residential densities in the GTA

Related:
Net residential dwelling unit density

Related:
Average population and dwelling unit density, by e...

Related:
Average household size, by era group

Related:
Average household size and average rooms and bedro...

Related:
Gross combined population and employment density

Related:
Private property as % of gross land area

Related:
Private property as % of developable land area

Related:
Public facilities as % of developable land area

Related:
Parks as % of developable land area

Related:
Schoolyard land as % of developable land area

Related:
Rights-of-way as % of developable land area

Related:
Parkland in hectares per 1,000 residents (excludin...
")
Related:
Parkland in hectares per 300 dwelling units (exclu...
")
Related:
Schoolyard area in hectares per 1,000 residents (e...
")
Related:
Schoolyard area in hectares per 300 dwelling units...
")
Related:
Residential parcel area as % of gross land area

Related:
Land consumption per dwelling unit: a non-linear r...

Related:
Housing type mix of study areas by net residential...

Related:
Single-detached

Related:
Apartments and duplexes

Related:
Ground-related

Related:
Attached (semis and rowhouses)
")
Related:
Housing type mix and average household size of stu...

Related:
Street patterns in different eras

Related:
Study area street networks

Related:
External connectivity (average distance in metres...
")
Related:
Road density (total road length in metres per deve...
")
Related:
Intersection density (intersections per developabl...
")
Related:
Intersection frequency (intersections per road kil...
")
Related:
Number of jobs per 400 hectares (gross land base)
")
Related:
Employment land as % of developable land area

Related:
Developable area employment density (jobs per hect...
")
Related:
The contribution of jobs density to combined popul...

Related:
Motorized (automobile, taxi, and motorcycle) mode...
 mode share for journeys to work, school and childcare, and shopping")
Related:
Ratio of jobs to resident employed labour force ov...

Related:
Non-motorized (walking and cycling) mode share for...
 mode share for journeys to work, school and childcare, and shopping")
Related:
Combined public transit (local and regional) and s...
Related:
Relating motorized mode share to neighbourhood acc...

Related:
Relating non-motorized mode share to neighbourhood...

Related:
Relating motorized mode share to density

Related:
Riverdale, City of Toronto (19th century)
")
Related:
Leaside, City of Toronto (1930s–50s)
")
Related:
Old Oshawa (19th century–1970)
")
Related:
Oshawa West (19th century–1970)
")
Related:
Whitby (pre-1960)
")
Related:
Brontë, Town of Oakville (1946–80)
")
Related:
The Peanut, City of Toronto (1960–80)
")
Related:
Milton (1970–90)
")
Related:
Meadowvale, City of Mississauga (1970–90)
")
Related:
Malvern, City of Toronto (1970–90)
")
Related:
Mississauga Valleys, City of Mississauga (1960–90)
")
Related:
Glen Abbey, Town of Oakville (1980s)
")
Related:
Markham Northeast (1980s)
")
Related:
Cachet, City of Markham (1990s)
")
Related:
Richmond Hill (1996–2001)
")
Related:
Vaughan (1996–2001)
")
Related:
The modifiable areal unit problem

Related:
Operation of the model

Related:
Hierarchy of land use categories

Related:
Study area locations

Related:
Population rates of change (%): 1996–2006
: 1996–2006")
Related:
The evolution of the Canadian urban retail system

Related:
Retail locations in the GTA: 1996 and 2001

Related:
Power node evolution in Vaughan (Highway 400...
: 1996–2005")
Related:
Enclosed regional and super-regional centres (unit...
")
Related:
Power retailing (units are ’00s of retail sq. ft.)...
")
Related:
Greenbelt and Distribution of Power Centres (2005)...
")
Related:
Distribution of Power Centres and Enclosed Malls b...
")
Related:
Trip start-time distributions for trips from home...

Related:
Trip start-time distributions for trips from all o...

Related:
Places to Grow & Places to Shop

Related:
Distribution of auto-driver shopping trips and VKT...

Related:
Power retailing (’00s of retail square feet) and t...
 and the 400-series highways")
Related:
Weighted Gaussian bivariate kernel estimation (uni...
")
Related:
Community and neighbourhood shopping (units are ’0...
")
Related:
Enclosed regional and super-regional centres (unit...
")
Related:
Enclosed regional and super-regional centres (unit...
")
Related:
Power retailing (’00s of retail square feet) and t...
 and the 400-series highways")
Related:
Relationship between New Housing Construction and...

Related:
The Transportation- Land Use Interaction

Related:
10 Super-zones in the COZ Study Area

Related:
Average Person Trips/ COZ, 2001

Related:
Change in Daily Person Trips COZ 1995-2001

Related:
Household Auto Ownership COZ 2001

Related:
Change in Household Auto Ownership COZ 1996 - 2001

Related:
Change in Mode COZ 1996 - 2001

Related:
Trip Mode Shares, All Trips COZ 2001

Related:
Growth in Travel vs. Population COZ 1996-2001

Related:
% of COZ Growth, Key Statistics COZ 1996-2001

Related:
1996 GTA Employment by Traffic Zone

Related:
1996 GTA Employment Density

Related:
Transportation Building Blocks for Smart Growth

Related:
Reference Map

Related:
High Incidence of Unemployment

Related:
High Incidence of Lone-Parent Families

Related:
High Incidence of Low Educational Attainment

Related:
High Incidence of Low Income

Related:
High Government Assistance to Households

Related:
Composite Map: Areas of Social Need

Related:
Composite Map: Areas of Social Need

Related:
Walk to Work Areas

Related:
Borderline Transit Supportive Density
Related:
Composite: Urban Form Opportunity Areas

Related:
Auto Travel: Low Delay by Area of Origin

Related:
Auto Travel: Low Delay by Area of Destination

Related:
Transit Capacity Origin Areas
Related:
Transit Capacity Destination Areas
Related:
Spare Capacity in Schools

Related:
Areas of Social Need

Related:
Composite: Areas with Capacity

Related:
Greenlands Systems in Central Ontario Zone

Related:
Greenlands affected by new urban growth in Brampto...

Related:
Greenlands affected by new urban growth in Wasaga...

Related:
Central Zone Smart Growth Zone

Related:
Agricultural Soil Classification, Central Ontario...

Related:
Metropolitan Indicators Poster

Related:
The Big Picture

Related:
Toronto Metropolitan Region - 'Elephant View' Post...

Related:
Socioeconomic variables relative to each other

Related:
Yonge and Dundas, looking south: On the east side...
, traditional store façades and of the west side (right), the Eaton Centre also presents store windows.")
Related:
Redevelopment in the Bloor-Yorkville

Related:
Chinatown: Narrow façades and diversity

Related:
Queen Street West

Related:
Yonge-Eglinton

Related:
North York Centre

Related:
Mel Lastman Square, North York Centre

Related:
Scarborough Town Centre

Related:
Scarborough Town Centre

Related:
Mississauga City Centre

Related:
Mississauga City Centre

Related:
Downtown Oakville

Related:
Downtown Kitchener

Related:
Downtown Kitchener

Related:
Municipality of Metropolitan Toronto’s 1981 Plan

Related:
Municipality of Metropolitan Toronto’s 1981 Plan
Related:
Major office floor space constructed 1990–2004 (bu...
")
Related:
Bloor-Yorkville

Related:
Chinatown

Related:
Queen Street West

Related:
Downtown Toronto

Related:
Yonge-Eglinton

Related:
North York Centre

Related:
Scarborough Town Centre

Related:
Mississauga City Centre

Related:
Downtown Kitchener

Related:
Downtown Kitchener

Related:
Downtown Toronto

Related:
Highway 401 Employment, GGH

Related:
Highway 404 Employment

Related:
Mississauga City Centre

Related:
Mississauga East Corridor

Related:
North York Centre

Related:
Oakville

Related:
Scarborough Town Centre

Related:
Yonge Street Corridor

Related:
Places to Grow

Related:
Major office floor space constructed 1990–2004 (bu...
")
Related:
Non-work Journeys to Downtown Kitchener

Related:
Non-work Journeys to Downtown Toronto

Related:
Non-work Journeys to Highway 401 Employment

Related:
Non-work Journeys to Highway 404 Employment

Related:
Non-work Journeys to Mississauga City Centre

Related:
Non-work Journeys to Mississauga East Corridor

Related:
Non-work Journeys to North York Centre

Related:
Non-work Journeys to Oakville

Related:
Non-work Journeys to Scarborough Town Centre

Related:
Non-work Journeys to Yonge Eglinton Centre

Related:
Non-work Journeys to Yonge Street Corridor

Related:
Work Journeys to Downtown Kitchener

Related:
Work Journeys to Downtown Toronto

Related:
Work Journeys to Highway 401 Employment

Related:
Work Journeys to Highway 404 Employment

Related:
Work Journeys to Mississauga East Corridor

Related:
Work Journeys to North York Centre

Related:
Work Journeys to Oakville

Related:
Work Journeys to Scarborough Town Centre

Related:
Work Journeys to Yonge Street Corridor

Related:
1948 Population distributions

Related:
1949 Service (water and sewer)
")
Related:
1963 satellite photo of residential development in...

Related:
1994 North Oakville

Related:
Transportation corridors in the TCR Concept
Related:
Transportation corridors in the TCR Concept
Related:
Water Supply System

Related:
1989 aerial view of Bathurst Street

Related:
2000, GTA and Hamilton Area Interregional Transit...
Related:
Timeline of Documents and Events

Related:
Timeline of Documents and Events

Related:
Past efforts to plan the region have met with mixe...

Related:
The potential impact of achieving the Growth Plan’...

Related:
Fig 8: Major office space less than 10,000 sq.m. b...

Related:
Major office space more than 10,000 sq.m. built 19...

Related:
Major office space more than 10,000 sq.m. built 19...
Related:
Land release in Sydney, Australia

Related:
Growth and constraints on development: Vancouver

Related:
Growing Cities

Related:
Policy constraints on urban expansion

Related:
Study areas for three regions, Toronto, Vancouver,...

Related:
Bands used in the urban fringe analysis

Related:
Conceptual diagram of the residential intensificat...

Related:
Configuration of submetropolitan zones

Related:
Study areas for the Toronto, Vancouver, and Calgar...

Related:
Urban land densities across the urban fringe

Related:
Urban patch analysis across the urban fringe

Related:
The location of intensification in Vancouver

Related:
The location of intensification in Calgary

Related:
The jurisdiction of the Metro Toronto Planning Boa...
")
Related:
The jurisdiction of the Metro Toronto Planning Boa...
Related:
Subcentres in the 1983 Metro Toronto Official Plan

Related:
Subcentres in the 1983 Metro Toronto Official Plan
Related:
The Lower Mainland (1946)
")
Related:
Cover of Bartholomew’s 1946 report

Related:
The Regional Concept in “Chance and Challenge” (19...
")
Related:
The urban structure vision for 1986 in the 1975 Li...

Related:
Calgary’s annexations (1884–2009)
")
Related:
Processing steps in the image analysis

Related:
Illustration of the linear removal process

Related:
A comparison of the alignment between census bound...

Related:
Overview of the process used to estimate intensifi...

Related:
Locations of designated node and downtown planning...

Related:
Similar spectral characteristics of different land...

Related:
Growth and constraints on development: Toronto

Related:
Growth and constraints on development: Calgary

Related:
Where are Greenlands Protected?

Related:
Housing Types, 2001

Related:
Revenue Canada Building, Surrey, BC, Busby + Assoc...

Related:
The Carrington, Calgary AB, Poon Mackenzie Archite...

Related:
Richmond City Hall, Richmond BC, Hotson Bakker and...

Related:
End-use energy consumption in petajoules, 1990-200...

Related:
End use of energy in Ontario by sector, 1990-2000

Related:
Per capita energy use by sector in Canada and othe...

Related:
Energy consumption per unit of GDP, 1997

Related:
Per capita energy use for the movement of people i...

Related:
Monthly crude oil prices

Related:
Actual and projected production of all oil and nat...

Related:
Bockstigen offshore wind farm, Sweden

Related:
Shares of weekday trips by residents of different...

Related: