Gallery
Primary tabs
Figure 5: Potential linkages for wastewater data s...

Related:
Figure 4: Potential linkages for water data source...

Related:
Figure 3: Matrix for evaluating data sources

Related:
Figure 6: Types of water systems in Ontario

Related:
Figure 2: Data fields for understanding wastewater...

Related:
Figure 1: Data fields for understanding water capa...

Related:

Related:

Related:

Related:
Brampton Development Application Selection

Related:

Related:

Related:
Unlocking the Potential of the Airport Megazone

Related:
AMZ - Executive Summary - 1

Related:
AMZ - Executive Summary - 3

Related:
AMZ - Travel, Transportation Patterns, and Transit...

Related:
AMZ - Travel, Transportation Patterns, and Transit...

Related:
AMZ - The employment geography of the megazone - 1

Related:
AMZ - The employment geography of the megazone - 2

Related:
AMZ - Employment Change - 1

Related:
AMZ - Types of Employment - 1

Related:
AMZ - Types of Employment - 2

Related:
AMZ - The Basics - 2

Related:
AMZ Figure 1

Related:
% Attached (semis and rowhouses)
")
Related:
% Single-Detached

Related:
% Apartments and Duplexes

Related:
% Apartments and Duplexes

Related:
Housing Type Mix and Average Household Size of Stu...

Related:
Street Patterns in Different Areas

Related:
Study Area Street Networks

Related:
External Connectivity (average distance in metres...
")
Related:
Road Density (total road length in metres per deve...
")
Related:
Intersection Density (intersections per developabl...
")
Related:
Intersection Frequency (intersections per road kil...
")
Related:
Number of Jobs per 400 Hectares (gross land base)
")
Related:
Employment Land as % of Developable Land Area

Related:
Developable Area Employment Density (jobs per hect...
")
Related:
The Contribution of Jobs Density to Combined Popul...

Related:
Combined Public Transit (local and regional) and s...
Related:
Motorized (automobile, taxi, and motorcycle) mode...
 mode share for journeys to work, school and childcare, and shopping")
Related:
Non-Motorized (walking and cycling) mode share for...
 mode share for journeys to work, school and childcare, and shopping")
Related:
Relating Motorized Non-Motorized Share to Neighbou...

Related:
Relating Motorized Mode Share to Neighbourhood Acc...

Related:
Figure 1: Manufacturing Employment as a Share of T...

Related:
Figure 2: Change in Employment by Skill Level, GGH...
")
Related:
Figure 3: Employment by Skill Level, GGH, 2001 and...
")
Related:
Figure 4: Change in GGH Employment 2001–2014, Tota...
")
Related:
Figure 5: Change in GGH Employment, 2001–2014, Tot...
")
Related:
Figure 6: Change in GGH Employment 2001–2014, Tota...
")
Related:
Composition of dwelling stock, GTHA and Metro Vanc...

Related:
Proportion of dwelling units accommodated through...

Related:
Net gain in population and dwellings, GTHA, 2001–2...

Related:
Composition of dwelling stock added in greenfield...

Related:
Composition of dwelling stock added through intens...

Related:
Composition of dwelling stock added in greenfield...

Related:
Composition of Dwelling Stock added through Intens...

Related:
Net gain in population and dwellings, Metro Vancou...

Related:
Metropolitan Indicators Poster

Related:
Understanding the implications of land budgets

Related:
The Issues Papers: Smart Growth Panel

Related:
Four Canadian Urban Regions

Related:
Downzoning in Markham

Related:
Understanding the Growth Plan's greenfield density...

Related:
20 years of population and land growth (1991-2011)
")
Related:
Housing Diversity- Vancouver v Toronto (1991-2011)
")
Related:
Metropolitan Indicators Poster

Related:
The Issues Papers; Smart Growth Panel

Related:
Population Growth vs Designated Land

Related:
Future projections of population versus land

Related:
Implementation of Growth Plan targets (Minimums ve...
")
Related:
Summary of Measurements: Scale of Analysis

Related:
Figure 3: Testing the Impact of Different Growth O...

Related:
Intensification Rates in the Greater Golden Horses...

Related:
Monthly wholesale natural gas prices

Related:
Per capita end use of energy by sector in Ontario...

Related:
The Growth Plan Purpose

Related:
Goals of the Growth Plan

Related:
Main policies of the Growth Plan

Related:
Population Growth vs Designated Land

Related:
Review of the Big Move: Benefits Case Analyses

Related:
Four Canadian Urban Regions

Related:
Main Geoweb

Related:
Four Canadian urban region: Vancouver, Edmonton, C...

Related:
Four Canadian Urban Regions

Related:
The Four Regions

Related:
Slow land consumption at urban edge: Vancouver, E...

Related:
How have Vancouver, Edmonton, Calgary, and Toronto...

Related:
% Population Increase vs % Urban Land Area Increas...

Related:
How Four Canadian Urban Regions Have Grown

Related:
Toronto: Canada's largest urban footprint

Related:
Toronto: Canada's Largest Urban Footprint

Related:
Allocation of population growth by upper-tier muni...

Related:
Net gain in population and dwellings, GTHA, 2001–2...

Related:
Proportion of dwelling units accommodated through...

Related:
Composition of dwelling stock, GTHA and Metro Vanc...
")
Related:
Composition of dwelling stock added in greenfield...

Related:
Composition of dwelling stock added through intens...

Related:
Net gain in population and dwellings, Metro Vancou...

Related:
Composition of dwelling stock added in greenfield...

Related:
Composition of dwelling stock added in greenfield...

Related:
Net Population Change in the GTHA

Related:
Growing Pains - Toronto vs. Vancouver

Related:
Growing Pains, Toronto vs. Vancouver
Related:
Growing Pains Net Population
Related:
Evolving Physical Condition of the GTA

Related:
The map summarizes transit projects currently fund...

Related:
Toronto Projected Growth

Related:
Visualizing Urban Futures: Geomatics Decision Supp...

Related:
The Big Move

Related:
Toronto: Canada's largest urban footprint

Related:
The Big Move, Metrolinx

Related:
Summary graphic: Proposed schemes by Metrolinx and...

Related:
Integrate the Built Boundary with the Urban Settle...

Related:
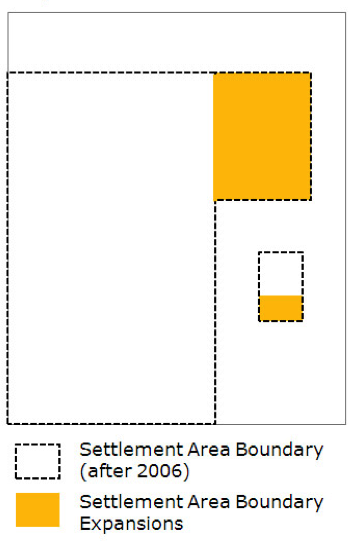
Classify remaining Settlement Area Boundary expans...

Related:
Classify Designated Greenfield Areas

Related:
Classify settlement areas as Urban or Rural.

Related:
Identify the Built Boundary: Built-Up Area for eac...

Related:
Settlement Area Boundary Expansions
Related:
Forecast Growth and Land Planned to be Urbanized,...

Related:
Amount of land designated for development, by sing...

Related:
Built boundary and settlement area boundary

Related:
Performance of the Richmond Hill Subway, Eglinton-...

Related:
Optimizing the Program

Related:
Fuel taxes, London UK

Related:
London Travel Report

Related:
Drawing from Metrolinx shows how the underground s...

Related:
Figure from Eglinton Crosstown BCA

Related:
Capital cost, net revenue, and new ridership for a...

Related:
Performance of subway and Transit City schemes

Related:
The current Metrolinx schemes will not deliver the...

Related:
Comparative Costs and Revenues of Different Modes

Related:
Graph prepared by Metrolinx to inform the debate o...

Related:
Average Annual Population Growth Rates, 1976-2001

Related:
Separated cities and use of alternative minimum de...

Related:
Comparison of land designated for growth, Inner an...

Related:
Land Supply for urban growth, by upper- and single...

Related:
Land designated for growth in the Greater Golden H...

Related:
Upper- and single-tier municipalities eligible to...

Related:
Comparison of land area designated as urban or rur...

Related:
Historic and forecast population growth in the Gre...

Related:
Location of the Whitebelt

Related:
Upper-tier municipal approaches to for allocating...

Related:
Generalized Municipal Official Plan Review and Gro...

Related:
Examples of upper-tier municipal approaches to all...

Related:
Examples of upper-tier municipal options for alloc...

Related:
Calculating intensification

Related:
Distribution of population growth, 2001–2041, Oute...

Related:
Distribution of population, Outer Ring municipalit...

Related:
Distribution of population growth in the Greater G...

Related:
Distribution of population growth 2001–2041, Inner...

Related:
Distribution of population growth 2001–2041, Inner...

Related:
Forecast population and employment and growth in t...

Related:
Distribution of population in the Greater Golden H...

Related:
Distribution of population, Inner Ring municipalit...

Related:
Municipal Growth Plan conformity planning process

Related:
Generalized land budget process

Related:
Anatomy of the region

Related:
Transportation Tomorrow Survey (TTS) Study Areas
 Study Areas")
Related:
Measuring intensification rates

Related:
Comparing two ways of defining the built boundary...

Related:
Intensification rates for upper-tier municipalitie...

Related:
Fifteen-year intensification rate, Greater Golden...

Related:
Intensification rates for the same time period, 20...

Related:
A3: Nosehill Park

Related:
Level of Protection: Dufferin

Related:
Level of Protection: Durham

Related:
Level of Protection: Halton

Related:
Level of Protection: Kawartha Lakes

Related:
Level of Protection: Niagara

Related:
Level of Protection: Northumberland

Related:
Level of Protection: Peel

Related:
Level of Protection: Peterborough

Related:
Level of Protection: Simcoe

Related:
Level of Protection: Toronto

Related:
Level of Protection: Wellington

Related:
Level of Protection: York

Related:
Waterloo Greenland's Classification

Related:
Land base definitions

Related:
Scales of analysis

Related:
Density gradient of the Toronto census metropolita...

Related:
Dwellings by census period of construction

Related:
Residential densities in the GTA

Related:
Net residential dwelling unit density

Related:
Average population and dwelling unit density, by e...

Related:
Average household size, by era group

Related:
Average household size and average rooms and bedro...

Related:
Gross combined population and employment density

Related:
Private property as % of gross land area

Related:
Private property as % of developable land area

Related:
Public facilities as % of developable land area

Related:
Parks as % of developable land area

Related:
Schoolyard land as % of developable land area

Related:
Rights-of-way as % of developable land area

Related:
Parkland in hectares per 1,000 residents (excludin...
")
Related:
Parkland in hectares per 300 dwelling units (exclu...
")
Related:
Schoolyard area in hectares per 1,000 residents (e...
")
Related:
Schoolyard area in hectares per 300 dwelling units...
")
Related:
Residential parcel area as % of gross land area

Related:
Land consumption per dwelling unit: a non-linear r...

Related:
Housing type mix of study areas by net residential...

Related:
Single-detached

Related:
Apartments and duplexes

Related:
Ground-related

Related:
Attached (semis and rowhouses)
")
Related:
Housing type mix and average household size of stu...

Related:
Street patterns in different eras

Related:
External connectivity (average distance in metres...
")
Related:
Road density (total road length in metres per deve...
")
Related:
Intersection density (intersections per developabl...
")
Related:
Intersection frequency (intersections per road kil...
")
Related:
Number of jobs per 400 hectares (gross land base)
")
Related:
Employment land as % of developable land area

Related:
Developable area employment density (jobs per hect...
")
Related:
The contribution of jobs density to combined popul...

Related:
Motorized (automobile, taxi, and motorcycle) mode...
 mode share for journeys to work, school and childcare, and shopping")
Related:
Ratio of jobs to resident employed labour force ov...

Related:
Non-motorized (walking and cycling) mode share for...
 mode share for journeys to work, school and childcare, and shopping")
Related:
Combined public transit (local and regional) and s...
Related:
Relating motorized mode share to neighbourhood acc...

Related:
Relating non-motorized mode share to neighbourhood...

Related:
Relating motorized mode share to density

Related:
The modifiable areal unit problem

Related:
Operation of the model

Related:
Hierarchy of land use categories

Related:
The evolution of the Canadian urban retail system

Related:
Retail locations in the GTA: 1996 and 2001

Related:
Power node evolution in Vaughan (Highway 400...
: 1996–2005")
Related:
Distribution of Power Centres and Enclosed Malls b...
")
Related:
Trip start-time distributions for trips from home...

Related:
Trip start-time distributions for trips from all o...

Related:
Distribution of auto-driver shopping trips and VKT...

Related:
Community and neighbourhood shopping (units are ’0...
")
Related:
Enclosed regional and super-regional centres (unit...
")
Related:
Enclosed regional and super-regional centres (unit...
")
Related:
The Transportation- Land Use Interaction

Related:
Average Person Trips/ COZ, 2001

Related:
Change in Daily Person Trips COZ 1995-2001

Related:
Household Auto Ownership COZ 2001

Related:
Change in Household Auto Ownership COZ 1996 - 2001

Related:
Change in Mode COZ 1996 - 2001

Related:
Trip Mode Shares, All Trips COZ 2001

Related:
Growth in Travel vs. Population COZ 1996-2001

Related:
% of COZ Growth, Key Statistics COZ 1996-2001

Related:
Transportation Building Blocks for Smart Growth

Related:
Socioeconomic variables relative to each other

Related:
Highway 404 Employment

Related:
Timeline of Documents and Events

Related:
Timeline of Documents and Events

Related:
The potential impact of achieving the Growth Plan’...

Related:
Conceptual diagram of the residential intensificat...

Related:
Urban land densities across the urban fringe

Related:
Urban patch analysis across the urban fringe

Related:
Processing steps in the image analysis

Related:
Overview of the process used to estimate intensifi...

Related:
Housing Types, 2001

Related:
End-use energy consumption in petajoules, 1990-200...

Related:
End use of energy in Ontario by sector, 1990-2000

Related:
Per capita energy use by sector in Canada and othe...

Related:
Energy consumption per unit of GDP, 1997

Related:
Per capita energy use for the movement of people i...

Related:
Monthly crude oil prices

Related:
Actual and projected production of all oil and nat...

Related:
Shares of weekday trips by residents of different...

Related: