Researchers have measured urban form patterns using different metrics. These include residential density, the mixture or separation of land uses in an area,[1] and the amount of automobile dependency of the area--or conversely, the "walkability" and transit-accessibility of an area (Clifton et al. 2008; Talen 2003). Queen's University professor David Gordon has categorized areas in Canadian city-regions by the predominant mode of transportation that residents use to commute to work to support his hypothesis that Canada is a suburban rather than urban nation (Gordon and Janzen 2013). University of Waterloo professor Pierre Filion, along with other researchers, has noted that the decade of construction of neighbourhoods often defines their urban form, with neighbourhoods built before the Second World War having narrower and more connected street grids, higher densities and mixed uses, while postwar neighbourhoods are characterized by single-family homes in residential-only neighbourhoods with curvilinear street patterns and organized into superblocks by wide arterial roads (Filion et al. 2010).
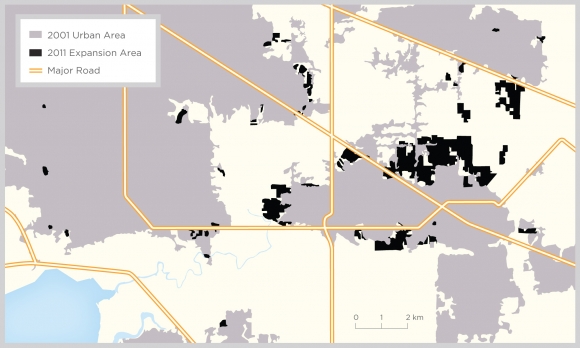
In our analysis, we categorize urban growth into one of two forms: intensification and greenfield development. In our study, these terms refer to both a process and a specific geographic area in a city-region (see Figure 4).
Figure 4: Urban footprints and urban form measurements

Note: Growth through intensification is measured within the 2001 urban area (shown in grey). Growth through greenfield development is measured within the 2011 expansion area (the additions in black).
Intensification is defined as net increase in new dwellings and/or population within the existing built-up urban area over a particular period of time. This process may occur even without specific policies to promote it and takes various forms: conversion (such as turning a former factory into loft apartments or adding secondary suites within existing houses), infill (building new residential units on previously vacant or underused lots), or redevelopment (demolishing existing buildings and constructing others where they once stood). In public policy terms, intensification is intended to achieve a number of goals, such as mitigating urban sprawl, optimizing the use of existing urban infrastructure, revitalizing downtown areas, or supporting public transit networks.[2]
Greenfield development is defined as the addition of new dwellings and population on previously undeveloped land through the expansion of the existing built-up urban area. Greenfield development involves subdividing previously rural land and extending municipal services and infrastructure, such as roads, water, sewers, and electricity, into these subdivisions. This process is sometimes equated with "urban sprawl," a term that usually connotes low-density development on formerly rural lands that produces communities in which residential uses are separated from other uses and residents require automobiles to get to work, school, and shops. However, it is important not to conflate the terms urban sprawl and greenfield development. In some cases, greenfield development may be more compact than well-established areas within the existing built-up area.
In this paper, we use spatial analysis techniques to determine the amount and location of growth occurring through intensification and greenfield expansion.
To measure growth in urban land, we delineated the built-up urban area in 1991 through the analysis of satellite imagery, which was subjected to a thorough visual inspection. We identified the expansion of this urban area between 1991 and 2001 using visual inspection of 2001 imagery and identified urban expansion from 2001 to 2011 using visual inspection of 2011 imagery.[3]
We measured dwelling and population growth through intensification and greenfield expansion by comparing the urban area footprints with census data on population and dwelling counts. The method used to calculate intensification for this report was tailored to compensate for the loss of the long-form census in 2011 (we were restricted to using the short-form census); a main benefit of this revised method is that it allows us to compare changes in population growth along with residential dwellings. For a detailed account of the method, see Appendix A.
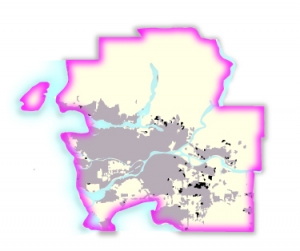
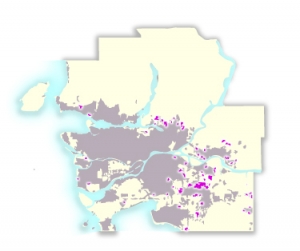
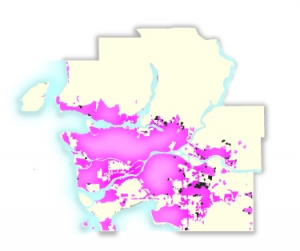
It is important to understand what is being measured where. In the body of the report, we use schematic maps to highlight in magenta where measurements are being made. These maps can be found at the beginning of each section and in Table 2.
In Table 2, we list the geographic scale at which we measured each metric. For a big-picture perspective, we examined two decades (1991-2011) of population, dwelling, and urban area increases to understand the rate at which each region is growing. We also compared the amount of regional growth that has occurred through intensification versus greenfield development. Finally, we examined the composition of the housing stock across each region for 1991, 2001, and 2011.
To better understand the subregional dynamics in each place, we mapped growth patterns of intensification and greenfield development for the more recent decade (2001-2011). We examined where intensification (net increase in dwellings and population) has occurred in the 2001 built-up urban area and greenfield growth in the 2011 expansion area. We examined the housing composition of each part of the regions and how the patterns of development compare across municipalities. Finally, we compared the growth patterns in policy-specific locations such as urban growth centres and near frequent transit networks in each city-region.
Table 2: Residential development pattern metrics by geographic area, 1991, 2001, and 2011
Geographic area | Metric |
City-region
| Change in growth (1991-2011): Absolute and percentage change in population, dwelling units, urban area for the region as a whole Intensification vs. Expansion (1991-2011): Proportion of dwelling growth through intensification and expansion. Housing Stock Composition (1991, 2001, 2011): Proportion of dwelling unit types (detached, attached, apartments[4] less than 5 storeys, apartments 5 storeys or more). |
Expansion area
| Population and dwellings (2001-2011): Addition and proportion of greenfield development in upper-tier municipalities and region. Urban Area increase (2001-2011): Expansion of the urban area outward from 2001 to 2011 resulting in the conversion from non-urban to urban land. Housing Stock Composition (2011): Proportion of dwelling types of new greenfield development built between 2001 and 2011 (detached, attached, apartments less than 5 storeys, apartments 5 storeys or more). Household size (2011): Average household size of new greenfield development (calculated by dividing the number of people by the number of dwellings).
|
Existing Urban Area
| Population and dwelling (2001-2011): Addition and proportion of intensification in upper-tier municipality and region. Housing Stock Composition (2011): Proportion of dwelling types in the existing urban area built between 2001 and 2011 (detached, attached, apartments less than 5 storeys, apartments 5 storeys or more). Spatial distribution of intensification (2001-2011): Map of location and amount of dwellings and population net change between 2001 and 2011; includes loss and gain. Household size (2001, 2011): Average household size calculated by dividing the number of people by the number of dwellings in the 2001 existing urban area for 2001 and 2011 census. Population and Dwelling Change in Policy Areas (2001-2011): Absolute and percent change in regional population and dwelling units in designated urban growth centres, select transit station areas, and frequent transit network (see earlier discussion for definition). |
[1] "Mixed use" refers to areas that have some combination of residential, commercial, institutional, industrial, and recreational land use within a given area.
[2] Although residential intensification may help cities achieve these outcomes, it is possible to find examples of intensification that do not. Some forms of intensification even have some undesirable consequences, such as overburdening aging infrastructure or contributing to road congestion in areas not well served by transit.
[3] This is a slightly different method from the one that was used in Taylor and Burchfield (2010), where the entire urban footprint was delineated for 1991 and for 2001 using a semi-automated method. The difference (subtraction) in the two urban footprints was used to calculate urban land growth. The urban land increase (1991-2001) calculation in Taylor and Burchfield (2010) included new urban areas developed within the 1991 built-up area, or urban infill. In the current paper, our analysis of urban land growth focuses on the expansion area to approximate more precisely how much urban land growth is attributed to greenfield development.
[4] In the Census, the term apartments refers to dwellings in any multi-unit residential building regardless of tenure (owned or rented). These "apartments" therefore also include condos.


