The form and structure of an urbanised area (including its density, the degree to which residential and employment uses are mixed, and the presence or absence of centres) has important impacts on the quality of life and competitiveness of the Zone.
Urban form has a clear relationship with daily distances travelled, especially by car (see Table 1). In the outer suburbs daily distances travelled are over three times greater than in the core of the region. This is because lower densities mean that on average, origins (say a home) and destinations (say a place of work or shopping) are simply farther apart.
Distances travelled have important implications for the demand for road infrastructure. Not only is more length of road required to serve the longer distances in low density areas, but more lanes and capacity are also required. This is because longer average trips mean that travellers tend to spend more time on the road per trip, in turn meaning that there are more cars on the road at any one time. Indeed, the amount of lane-kilometres per capita is indeed much higher in low density areas. Research has shown for example, that in the core of Toronto, there are 1.7 metres of road per person, compared to 3.6 in the inner suburbs, and 5.5 in the outer suburbs.5 Thus greater demand for travel translates into increased infrastructure costs.
Because of increased distances, other modes of travel are also less viable in low density, single use areas, such as transit, walking and cycling. Urban form has a clear relationship with the propensity to take transit (see Table 1). This has to do in part with the available supply of transit services - it is much harder to make transit economically viable in areas with lower density development, and to provide the high levels of transit service that attract riders
Table 1: Travel characteristics by urban zone, Toronto area, 1996
|
Area |
Percentage of households with no car |
Daily km per person by car |
Daily km per person by transit |
% daily trips by transit, walking or cycling |
|
Core |
51.9 |
6.8 |
3.6 |
60 |
|
Core Ring |
31.5 |
10.2 |
3.9 |
37 |
|
Inner Suburbs |
17.4 |
13.4 |
4.0 |
24 |
|
Outer Suburbs |
5.8 |
23.2 |
2.5 |
12 |
Source: Data from the Transportation Tomorrow Survey, 1996, prepared by the Centre for Sustainable Transportation.
Both of the above factors (distance travelled and mode of travel) naturally affect the amount of emissions related to passenger travel. Emissions are directly related to amount travelled - the more kilometres travelled by car, the greater the amount of pollutants emitted into the air. Walking and cycling are much more viable in denser, mixed use environments. These zero emission modes can and do account for a substantial share of trips in denser, mixed use areas - representing one-third of all trips in the core of Toronto, for example.
Directing new growth to compact, mixed use areas can help to reduce car travel and support increased transit ridership.
There are also urban areas within the Zone that at present are not mixed-use or whose densities are not particularly efficient. These areas could benefit from an improved mix of uses and more effective density levels. This structural retrofitting can be achieved by strategically directing some of the anticipated growth in the Zone to those areas.
Directing new growth to these areas can also improve the level of amenities, services and shops accessible to residents. It can help to diversify the local housing stock, and provide, for example, apartment or condominium options for older households who wish to downsize but remain in their neighbourhoods, or provide opportunities for first-time homebuyers to stay in their communities.
Walk-to-Work Areas
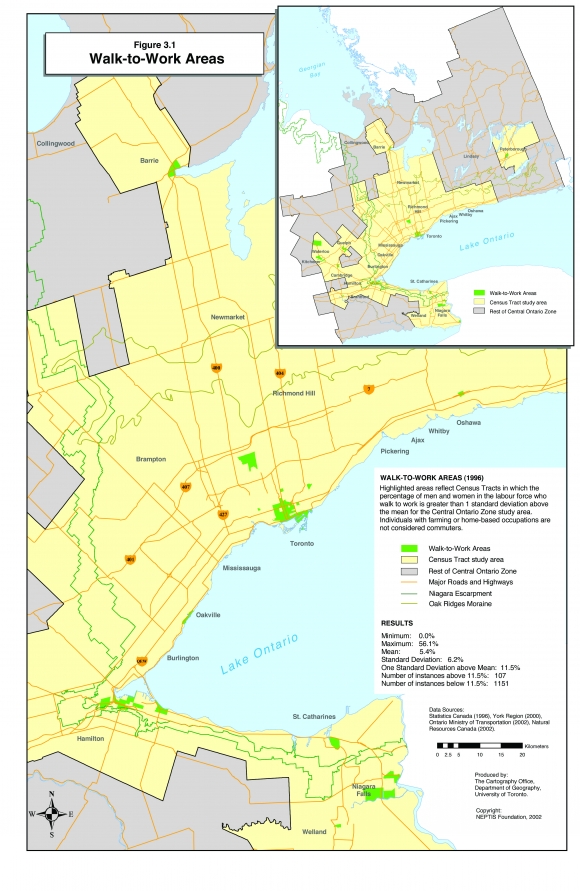
Figure 3.1 shows those areas with relatively high incidence of walking to work. Areas where walking to work is possible tend to be mixed use (i.e. they must contain the residence and place of work in close proximity - walking distance), and higher density. As a rule, these tend to be the older, pre- and early post-war urban areas within the Zone. This is confirmed by Figure 3.1, which shows the central areas of mature cities such as Niagara Falls, St. Catherines, Hamilton, Oakville, Kitchener-Waterloo, Guelph and Toronto having a relatively high incidence of walking to work. Inner and outer suburban areas (with the exception of the North York City Centre and York University areas) do not exhibit high incidence of walking to work.6
The areas identified on the map are areas in which the introduction of new residential and/or employment-related development can result in lower than average demand for auto travel and support existing transit routes, amongst other benefits.
Single Use Areas
The walk-to-work areas are areas that are already performing well - in terms of providing a mix of employment and residential uses, efficient densities, and reduced auto travel. Other areas are lacking some of these qualities. However, anticipated growth in the Zone provides the opportunity to improve the performance of large areas that are relatively single-use in nature, or have densities that are close to being efficient (in terms of supporting economically viable transit, for example).
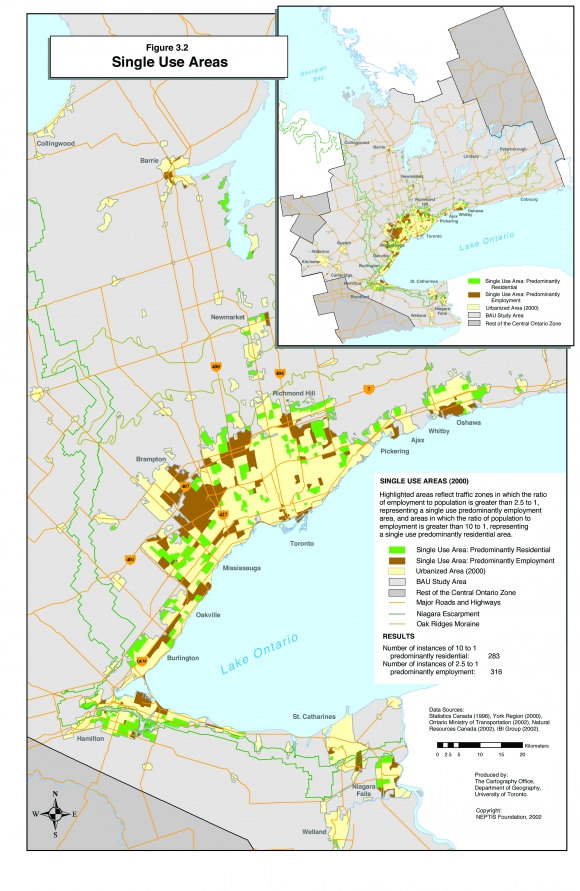
Figure 3.2 highlights "single use areas", that is, areas that are predominantly residential (shown in green) or predominantly employment-oriented (shown in brown). Other areas (shown in yellow) exhibit a reasonable mix of jobs and residents.
The map indicates that many areas have a mix of residential and employment uses. The predominantly single use areas tend to represent newer development, at or near the urban fringe across the urban portion of the Zone. Some of these single use areas are very large. Older pre- and early post-war areas tend to be more mixed.
The single use areas could benefit the introduction of complementary uses: adding employment uses in primarily residential areas and residential development in areas currently dominated by employment uses. Main streets or large underutilised properties may provide opportunities for this kind of diversification. This could help to reduce commuting distances, as well as improve the range of services and amenities within single use areas.
Borderline Transit Supportive Density
The cost-effectiveness of transit systems has been clearly linked with achieving certain minimum densities of development. Denser development delivers the critical mass of riders needed to make transit economically viable. Indeed, research has identified certain minimum density levels necessary to support various levels of transit service efficiently.7 A minimum level of 4,000 persons per square kilometre is often taken as a threshold for providing a basic level of transit service cost-effectively.
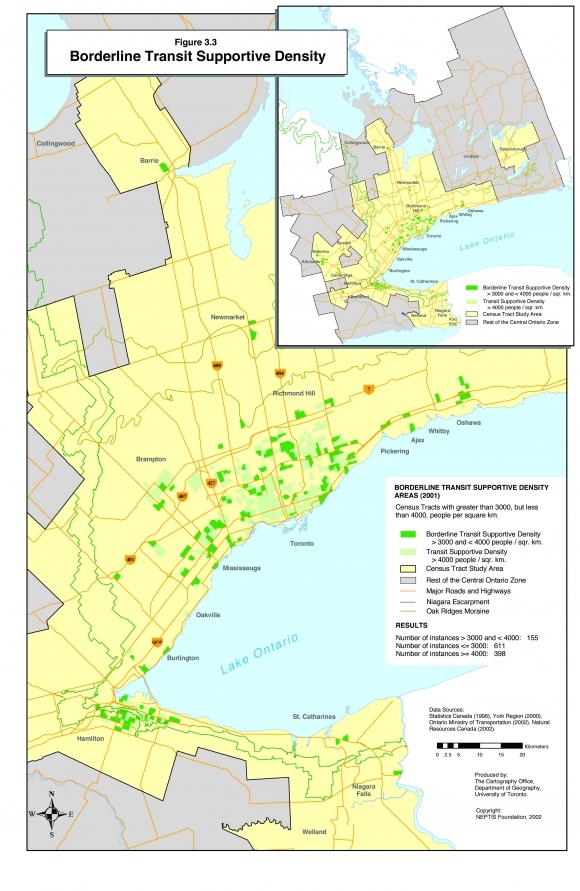
Figure 3.3 shows areas in which this threshold density has been reached (pale green) and where densities are just below this threshold (dark green).
Although the map shows that transit-supportive areas are mostly found in and around the City of Toronto, other areas such as parts of Brampton, Mississauga, the Highway 7 corridor, Hamilton and a number of smaller areas between Toronto and Oshawa are also highlighted.
Directing growth to the areas highlighted will help support the cost effectiveness of transit in these areas. By increasing the number of potential riders, it could also allow for improved levels of service, which in turn could attract still more riders. Where investments in new transit routes are contemplated, the map can help to indicate areas in which these new investments might be most successful.
Urban Form Opportunity Areas
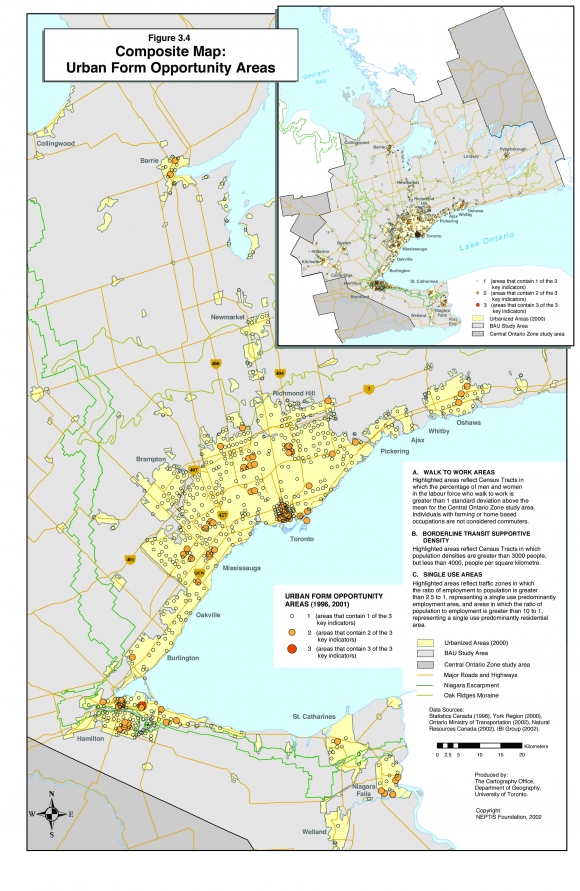
Figure 3.4 overlays the three urban form indicators described above. The central areas of the City of Toronto, Niagara Falls, Hamilton, Kitchener-Waterloo and Guelph are primarily the walk-to-work areas. These areas already exhibit a mix of uses and compact development. Directing new growth to these areas would result in continued benefits, including lower levels of auto travel and emissions per household, and support for transit.
Outside of these cores, the remaining highlighted areas are primarily those that might deliver particular benefits if new growth were strategically directed to them. These are the areas of single-use and borderline transit-supportive density. Where the large circles are shown, both these conditions exist, suggesting areas where new growth of the right type (i.e residential development in employment areas and employment growth in residential areas) might deliver both mixed use and transit-supportive densities. Such areas tend to occur in pockets within the inner suburbs of the GTA, and Hamilton.
Retrofitting and improving these areas by adding complementary uses would simultaneously improve the job-housing mix in the area and add the density necessary to make transit a more viable proposition.
Notes
5. Urban Travel and Sustainable Development The Canadian Experience, prepared for the Canada Mortgage and Housing Corporation by IBI Group, 1993.
6. In fact, the North York City Centre provides a good example of how urban retrofitting works. While capitalising on the embedded subway infrastructure, new development resulted in higher levels of walking to work, diversification of the local housing stock, and brought new services and amenities to the area.
7. For example, see Berridge Lewinberg Greenberg Ltd., Guidelines for the Reurbanisation of Metropolitan Toronto, prepared for the Municipality of Metropolitan Toronto, 1991; IBI Group, Transit Supportive Land Use Planning Guidelines, Ontario MMAH/MTO, April, 1992; Pushkarev, Boris S. and Zupan, Jeffrey M. Public Transportation and Land Use Policy, Indiana University Press, Bloomington and London, 1977; Fischler R., Forme urbaine, developpement metropolitain et mobilite des personnes (urban form, metropolitan development and personal mobility in the Montreal region) Report submitted to the Commission de Consultation sur l'Amelioration de la Mobilite entre Montreal et la Rive-Sud. Montreal: Ministere des Transports du Quebec, 2002.


