While obviously not providing a solution to social problems, directing growth to areas with higher social needs can make a positive contribution. Undertaken sensitively and strategically, new growth can help to:
- improve the quality of the local physical environment
- introduce new services (such as retail or personal services)
- bring jobs closer to local residents, and
- realise improvements to public infrastructure, such as community centres or better public transportation.
In other words, a Smart Growth strategy can play a role in addressing areas of social need.
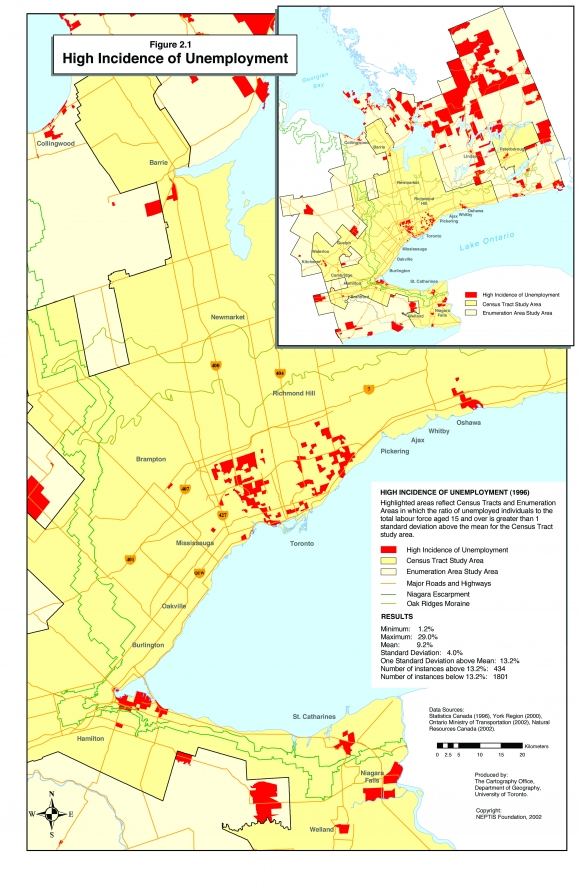
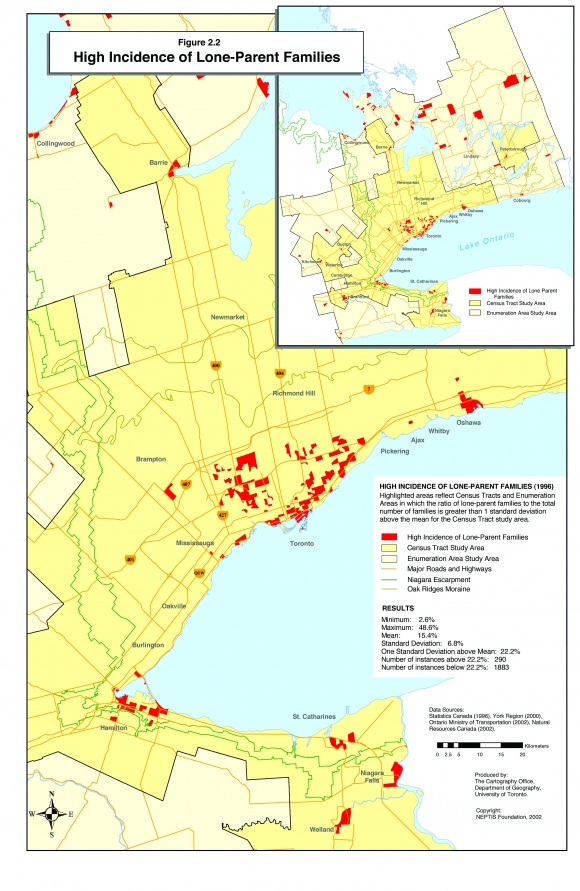
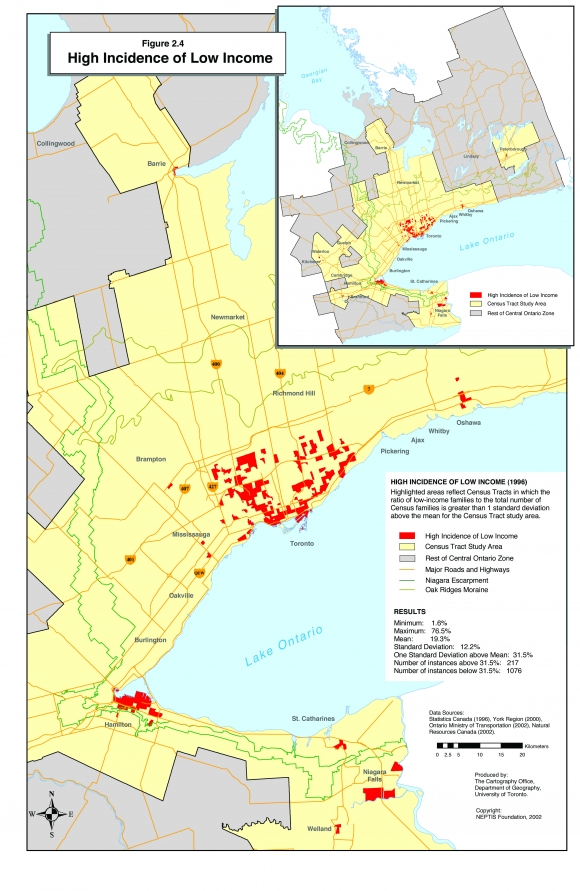
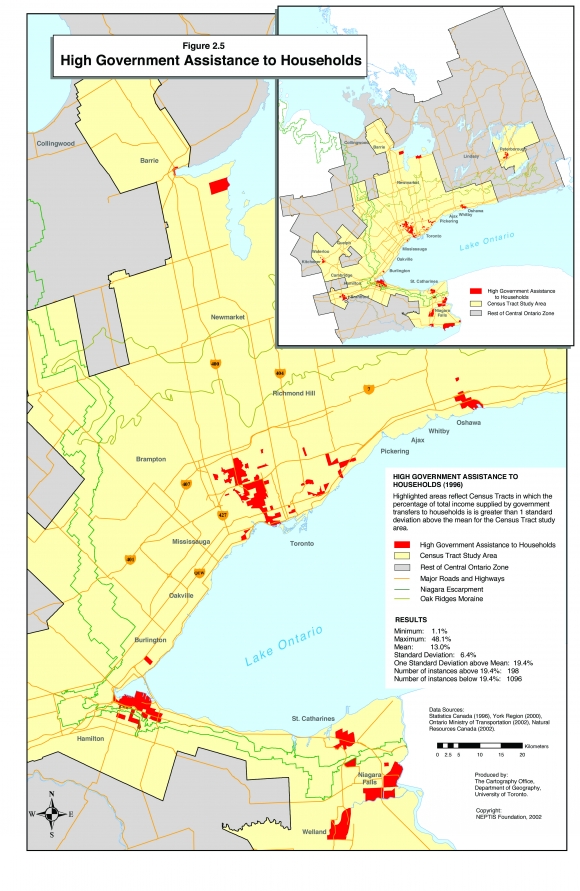
A range of key social indicators was used to identify areas of social need in the Central Zone, as shown in Figures 2.1 through 2.5. In particular, these maps show the areas in which incidence of these indicators has been found to be significantly higher than the average values observed across the Zone.3 While the indicators are inter-related, each tells a slightly different story and contributes to a sharper picture of the Zone's areas of need.
High Incidence of Unemployment
As shown on Figure 2.1, many older urban areas in the Zone display a high incidence of unemployment, including Toronto, Hamilton, Oshawa and Niagara Falls. But unemployment is not limited to cities. Rural areas closer to the Zone's borders, such as Haliburton, Simcoe and Kawartha Lakes also exhibit above average levels of unemployment. Notably spared is the entire Greater Toronto Area outside of Toronto and Oshawa.
High Incidence of Lone-Parent Families
As shown on Figure 2.2, areas demonstrating a relatively high incidence of lone-parent families occur primarily in the Zone's urban areas. There are concentrations in the City of Toronto, particularly in the east, west, and south areas of the City. Other areas demonstrating relative concentrations include Hamilton, St. Catherines, Niagara Falls and Oshawa. Some sporadic cases also occur in the Zone's rural areas, such as Haliburton, Kawartha Lakes and Simcoe County.
High Incidence of Low Educational Attainment
Low educational attainment is observed in many of the same areas as the previous indicators (Figure 2.3). However, some additional areas display high concentrations, such as the areas in Waterloo and Wellington, and in the City of Vaughan. In the City of Toronto, instances of concentrations are confined mostly to the western and southern portions of the city.
High Incidence of Low Income
Figure 2.4 shows areas with high incidence of low income, based on Statistics Canada's Low Income Cut Off (LICO). Like the previous indicators, low-income areas tend to be found in the older urban centres, such as Toronto, Hamilton, Oshawa and Niagara.
High Government Assistance to Households
This measure reflects the percentage of the combined income of all households within a census tract attributed to government transfers.4 Included is income from: Old Age Security pension and Guaranteed Income Supplement, benefits from Canada or Quebec Pension Plan, benefits from Unemployment Insurance, federal Child Tax benefits, and other income from government sources.
Again, areas in the more mature urban centres are especially dependent on government transfers. As with the measure of educational attainment, however, Scarborough does not appear, as it does for some of the other social indicators.
Areas of Social Need
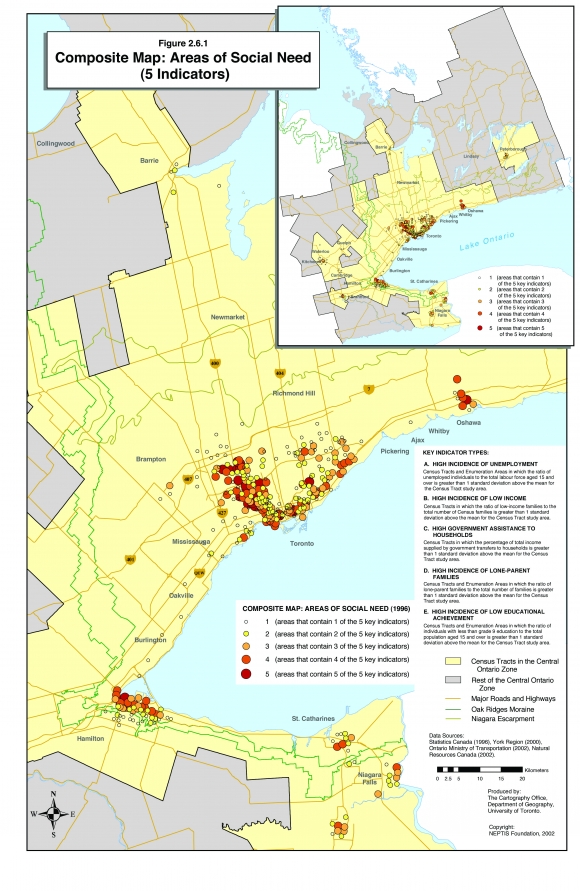
The composite maps show areas in which several indicators of social need are present. Figure 2.6.1 is based on a composite of the five preceding indicators. The area covered in the map is the census tract study area, which represents the area for which we have data for all of the five indicators.
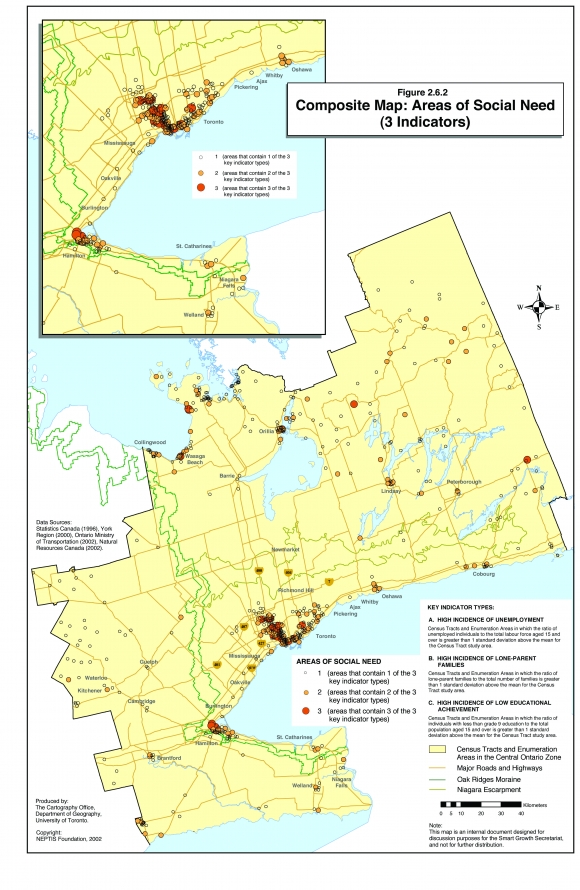
Figure 2.6.2 presents a composite of the three social indicators for which we have data across the entire Zone.
Within the urban areas of the Zone, both composite maps suggest the same pattern of social need. The areas of concern are primarily a U-shaped area within the City of Toronto, as well as the older parts of Hamilton and Oshawa, and smaller centres such as Kitchener/Waterloo, St. Catherines, Niagara Falls, Brantford and Orillia. Rural areas also show concentrations of social need, as indicated on Figure 2.6.1, including parts of Haliburton, Kawartha Lakes, the Georgian Bay shoreline, Waterloo and Wellington.

