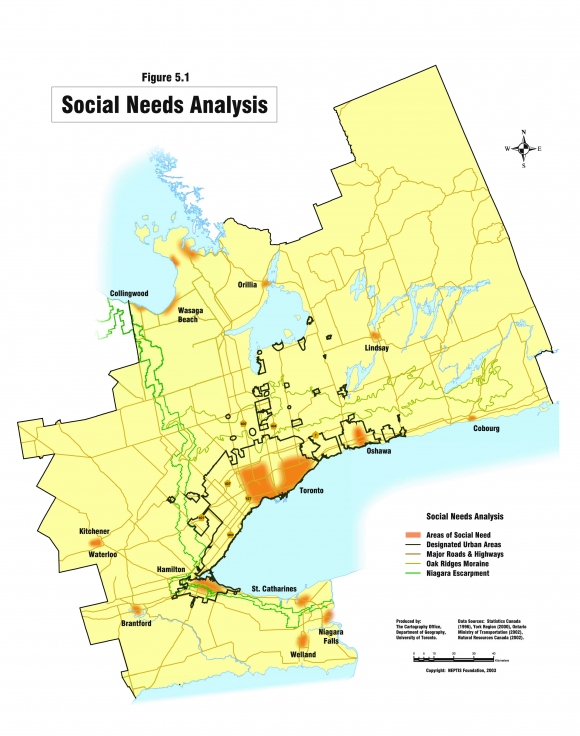
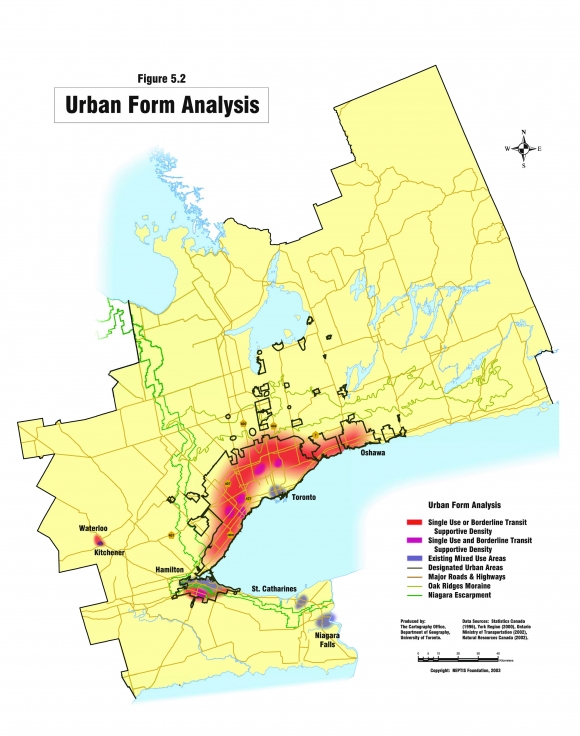
Each of the three composite maps presented above has been graphically simplified, and is presented in Figures 5.1, 5.2 and 5.3.
Figure 5.1 highlights areas that show above average incidence of a range of socio-economic indicators - in other words, areas of particular social need. Directing new growth to these areas can contribute to the socio-economic regeneration of these areas, by improving the quality of the physical environment, or increasing the range of services or employment opportunities, for example. A Smart Growth strategy for the Central Ontario Zone may also include an explicit social component, which focuses more comprehensively on addressing socio-economic issues in these areas.
Figure 5.2 shows areas with particular urban form conditions. The purple areas are those that already contain a mix of employment and residential uses, and are relatively dense. These are areas to which new growth could be directed to continue to support these attributes, resulting in lower than average car travel, higher incidence of walking, lower infrastructure costs, and other positive outcomes.
The pink areas, on the other hand, are those in which urban form suffers from either being single-use, or exhibits densities that are borderline transit-supportive. The performance of these areas could be improved, and these areas made more efficient, transit-supportive and mixed by directing new growth here. The areas of darker pink show places in which this is particularly true - that is, areas that have both borderline densities and single uses. Directing growth to these areas will be especially beneficial, addressing both these issues at the same time.
Figure 5.3 shows areas within the Central Zone where there are existing infrastructure capacities - particularly with respect to transit,15 walk to work and school capacity. Most of the established, existing built-up areas of the GTA show some potential, particularly with respect to school capacity. Areas with particular concentrations of existing capacity, however, can be found in the older parts of the region (as shown by the darker colouring) - in the core of the City of Toronto, and in older outlying centres such as Kitchener-Waterloo, Guelph, or Hamilton.
These areas can accommodate new residential growth at low marginal costs, particularly in comparison to greenfield locations, where the full range of new infrastructure must be provided from scratch.16 Other benefits can also result, such as increased transit ridership on existing services, improved local services and amenities, a more diversified local housing stock, and reduced pressure for development on agricultural lands or natural areas. Naturally, new development in these areas would have to be proactively planned for on appropriate sites, and be compatible with existing development.
In places where there is overlap on the three summary maps, it suggests that new growth in these locations can accomplish a range of positive social, urban form and infrastructure cost minimisation benefits. These areas include: Niagara Falls, St. Catherines, Hamilton, Kitchener-Waterloo, Oshawa, and the core of the City of Toronto. There is therefore a strong rationale for directing growth to these locations, and for these places to play a key role in a Smart Growth strategy for the zone, and for appropriate implementing policies and practices to be put in place to see this happen.
To a lesser extent there is overlap (of urban form and capacities) in a band stretching from Oakville through Toronto's inner suburbs. Strategically deployed, directing growth to these locations can also bring about significant benefits.
In short, the summary maps identify places to which new growth can be directed in order to realise a range of benefits - in other words, in order to use the substantial new growth anticipated in the Central Zone in the smartest, most strategic way possible.
While in some respects we have not been doing badly in the region in managing growth, there is still much room for improvement. There are ways to be a lot smarter about growth and leverage it to its maximum potential benefit and competitive advantage.
If smart growth indeed means being smarter about growth, then "growth management" must be taken to the next level in the region. Greater attention needs to be paid to where the growth should go, and what kinds of growth should go where. Proactive strategies for retrofitting and accommodating growth in the already-urbanised areas are needed. It means being much more strategic about dealing with growth, treating it as the powerful resource that it can be if managed effectively and intelligently.
This inevitably means a change to the "business as usual" development patterns we have seen in the zone, and that will continue to emerge unless proactive measures are undertaken to create a smarter, more efficient development pattern. Truly smart growth can result in a more cost effective, environmentally sustainable and competitive region that can deliver tangible benefits to current and future residents of the Zone.


