An economy undergoing transformation
In recent years, the economy of the Greater Golden Horseshoe has been undergoing a remarkable transformation and restructuring, driven by two powerful, interrelated forces: a globalizing economy and rapid technological change. Freer trade opens up new markets and growth opportunities for local businesses, while exposing those firms to wider competition and intensified competitive pressures. New information and communications technologies allow production of goods and services to be managed at a distance as well as the inexpensive and instantaneous flow of information, ideas, capital, and digital products around the world.
These forces are transforming not just the makeup of the economy, but the region's economic landscape. The transformation has important implications for planning in general and more specifically for the regional plan, Growth Plan for the Greater Golden Horseshoe (2006). In addition to managing population growth and curbing urban sprawl to ensure an efficiently functioning region, the Growth Plan is intended to support prosperity and competitiveness in the GGH. Indeed, the Plan places prosperity at the centre of its policies:
This Plan will guide decisions on a wide range of issues - transportation, infrastructure planning, land-use planning, urban form, housing, natural heritage, and resource protection - in the interest of promoting economic prosperity. It will create a clearer environment for investment decisions and will help secure the future prosperity of the GGH (Ministry of Public Infrastructure Renewal, 2006, p. 6).
Yet the Growth Plan is based on shockingly little hard evidence on the current and evolving economy of the region and its implications for land use planning. Plans for cities a fraction of the size of the GGH typically involve more research, analysis, and evidence. The Plan's focus has largely been on managing residential growth rather than non-residential development and employment-related activities.
The Province is currently undertaking the 10-year review of the Growth Plan as part of the coordinated review of the Growth Plan, Greenbelt Plan, Oak Ridges Moraine Plan, and the Niagara Escarpment Plan.
This report is intended to assist that review and address the knowledge gap by examining the changing structure of the Greater Golden Horseshoe's economy, mapping the evolving geography of employment, and making important connections between planning and economic development.
A note on data sources:
Two primary sources are used in this report for employment data. The first is the Statistics Canada Labour Force Survey, used in relation to the GGH as a whole. The data represent the nine Census Metropolitan Areas within the Greater Golden Horseshoe, and are available annually up to 2014.
The mapping and sub-regional analysis are based on employment data from the Census of Canada Long Form Census (for 2001 and 2006) and the National Household Survey (for 2011). The data cover the entire GGH. The data are related to place of work, and therefore include only those jobs that have a usual place of work. For 2011, these jobs totalled about 3.5 million in the GGH. Not included are some additional 772,000 jobs without a usual place of work, as well as jobs carried out at home or outside the country. Unemployed workers are also not included.
A change in the method used for the 2011 Census has raised some issues about the reliability of this data, and its continuity with previous years. It is also important to note that there are discrepancies among these data sources, and the overall totals for employment vary according to the source. Appendix C provides more detail about the data used.
We have also drawn on commuting data from the Transportation Tomorrow Survey (TTS) for 2011.
A shift from routine to knowledge-intensive activities
The economic restructuring currently under way is often described as a shift from manufacturing to service industries. This characterization, however, does not capture the dynamics of change nor provide the kind of information needed to plan effectively for a competitive city-region.
It is true that employment in manufacturing in the Greater Golden Horseshoe has dropped in recent decades. Indeed, the declining role of manufacturing employment is a long-standing trend in Ontario,[1] going back to at least 1980[2] (Figure 1). By 2013, manufacturing, once the largest sector in the province, accounted for about 11% of total jobs.[3] In the GGH, some 200,000 manufacturing jobs were lost between 2001 and 2014 - a decline of 28%, while almost one million jobs were created in other sectors.
Figure 1: Manufacturing Employment as a Share of Total Employment, Ontario, 1976-2014[4]
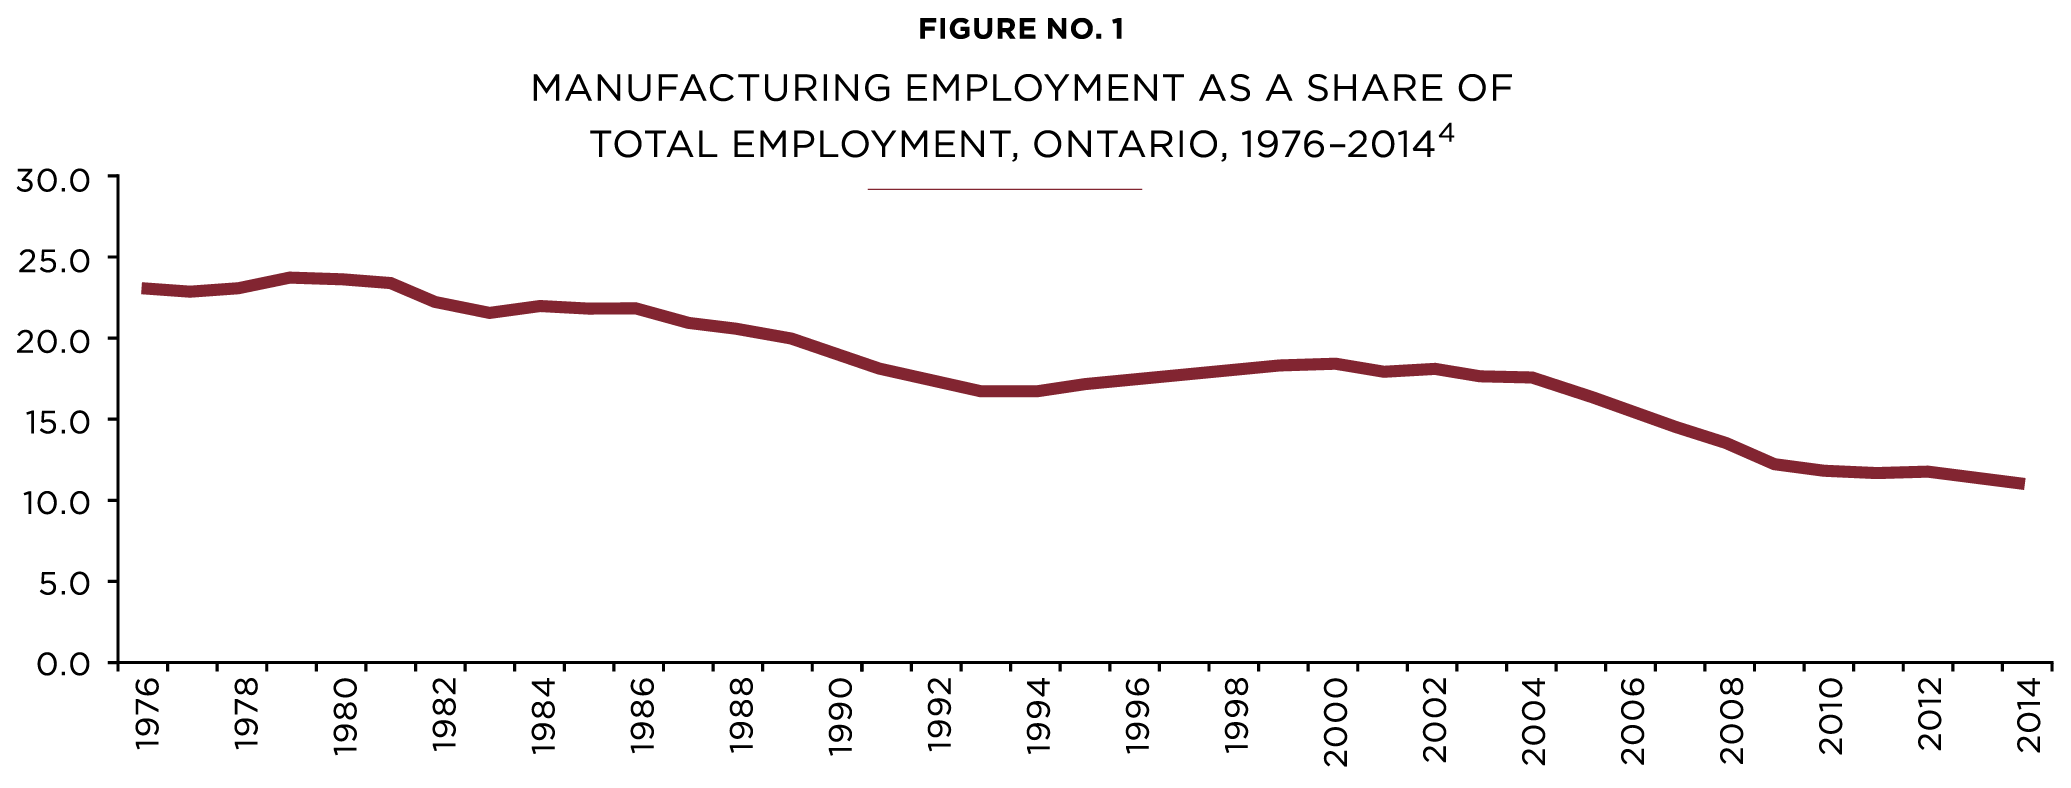
In earlier decades, manufacturing industries suffered job losses, but managed to maintain output levels through increased efficiency and productivity. Since about 2001, however, the situation has changed, as the manufacturing sector has been characterized by both job losses and diminished output. Manufacturing sector[5] output in Ontario declined from $93 billion in 2001 to $75 billion in 2013, almost 20% in terms of real annual GDP.[6] Meanwhile, the provincial GDP as a whole grew by 21%.
But this is not the whole story. Traditional industry classifications mask a lot of heterogeneity within each category. If we dig a little deeper, we see that certain manufacturing activities are not only not declining, but have experienced growth in output, while not all service industries are growing (see text boxes)[7].
For example, although pulp and paper manufacturing has declined dramatically in Ontario, high-value-added activities, such as engineered woods, are still produced and exported. And while clothing production has largely moved offshore, fashion design and brand development activities are successful in the GGH. On the other hand, some service-sector activities such as employment agencies, travel agents, call centres, business service centres, and credit bureaus[8] have seen declining output. "Back-office" functions like record-keeping and billing have shown below-average GDP growth.[9]
CERTAIN MANUFACTURING ACTIVITIES ARE NOT ONLY NOT DECLINING, BUT HAVE EXPERIENCED GROWTH, WHILE NOT ALL SERVICE INDUSTRIES ARE GROWING.
What kinds of industries have been growing? Electric power engineering construction Meat products Aerospace Steel products Pharmaceuticals & medical products manufacturing Wholesale & distribution Software developing & publishers Computer systems design services Telecom services (incl. cable, satellite, broadband, telephone providers) Architectural & engineering services Financial investment services Universities Selected industries, based on GDP growth above the provincial average for services or manufacturing as a whole, 2001-2013 |
What kinds of industries have been declining or slow growth? Textile manufacturing Pulp & paper mills Iron & steel mills Communications equipment manufacturing Electrical equipment manufacturing Furniture manufacturing Non-internet newspaper, periodical & book publishing Insurance Employment services Travel services Business support services, e.g., call centres, billing centres Selected industries, based on GDP growth below the provincial average for services or manufacturing as a whole, 2001-2013, last three based on 2007-2013 |
The economic restructuring under way is therefore more accurately described as a shift from low-value-added to high-value-added activities, from low-knowledge-content to knowledge-intensive activities, and from routine to creative and executive activities. This distinction holds whether the activities are in the manufacturing or services sector.
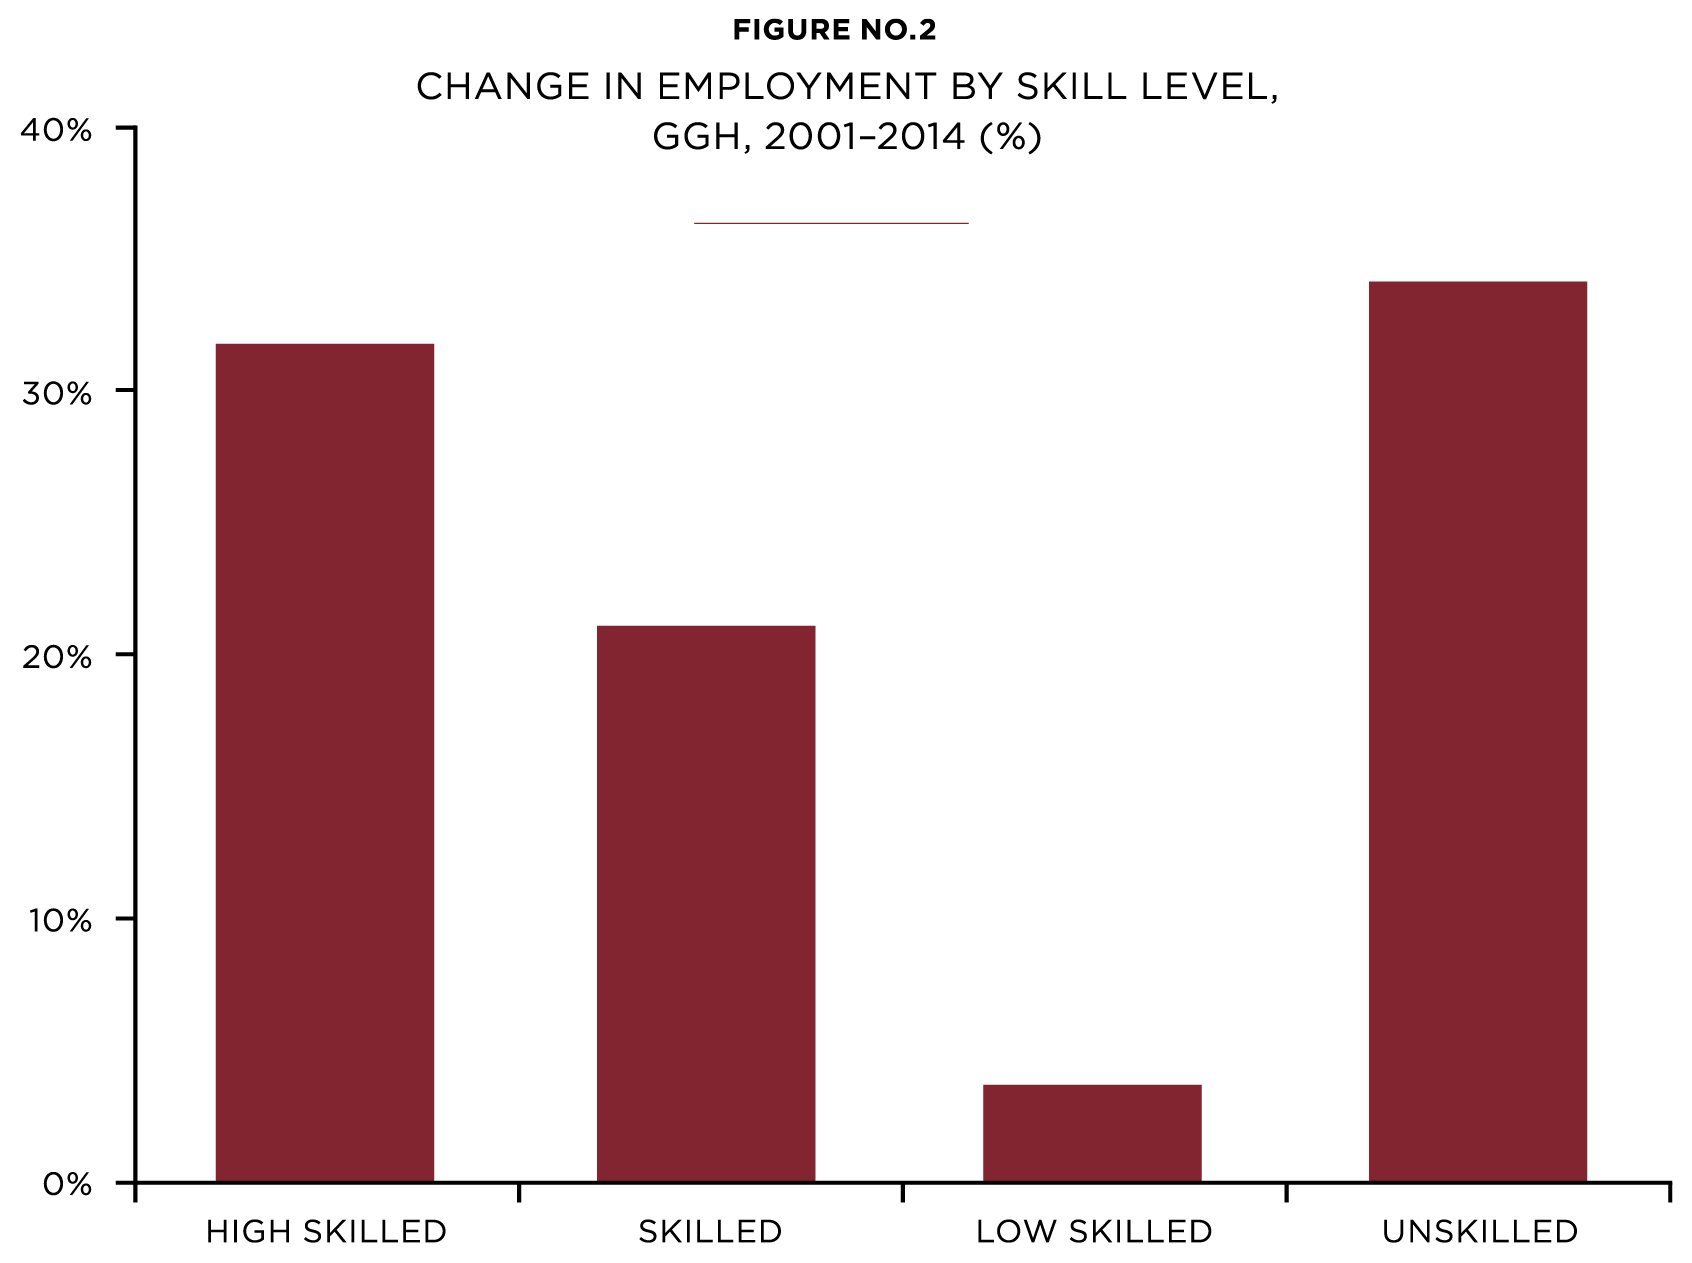
Figure 2 captures the underlying dynamic of restructuring under way in the GGH.[10] Employment in the highest-skilled, most knowledge-intensive types of work has grown by 33% since 2001, well above the regional average of 21%. Examples of jobs in this category are managers, information systems analysts, engineers, investment professionals, and teachers. Unskilled jobs, that typically cannot be moved off-shore or automated (e.g., cleaners or caregivers), have also been increasing. Employment in the low-skilled segment, where routine jobs are concentrated, has experienced very little growth. In fact, although there was marginal growth overall in this category, many types of routine jobs saw net losses, including 19,000 assembly-line workers, 23,000 machine operators, 24,000 secretaries, and 11,000 finance and insurance clerks.[11]
Figure 2: Change in Employment by Skill Level, GGH 2001-2014 (%)
TRANSFORMATION IS NOT ONLY ABOUT THE GROWTH OF EMPLOYMENT, BUT ALSO ABOUT JOB LOSSES IN CERTAIN SECTORS AND LOCATIONS.
Figure 3 shows employment change by skill level in terms of the number of jobs.[12]
 Figure 3: Employment by Skill Level, GGH, 2001 and 2014 (000s of jobs)

In terms of achieving the objectives of the Growth Plan, this restructuring has important implications for the kinds of economic activities we are planning for. Moreover, transformation is not only about the growth of employment, but also job losses - a fact that can sometimes be obscured when regional planning is based solely on growth projections.
The importance of core employment
Given the focus on implications for the Growth Plan and long-term planning, this report is concerned with the dynamics of long-term, structural change brought about by globalization and evolving technology, not cyclical market fluctuations. Especially critical are products and services that can be exported, or that draw income into the region, and so are the foundation of economic development. Sometimes referred to as the "tradeable" or "basic" sector, here we call them "core" economic activities.
They include employment in manufacturing, finance and business services, tourism, arts and culture, wholesale trade, research and development, major hospitals, and higher education. (Except where noted, in the following sections we do not consider in depth the remaining component of employment - "population-related" or "local" services - as these depend on the core economic activities. They include retailing, personal services, and elementary and secondary education.)
What does a transforming economy mean to the review of policies in the Growth Plan for the Greater Golden Horseshoe?
The targets and policies in the Growth Plan focus mainly on managing residential growth. Yet several key objectives of the Growth Plan depend on non-residential development activity or "employment uses" for their success. These objectives include:
- a compact, transit-supportive urban form
- a regional structure anchored by Urban Growth Centres
- a high degree of intensification
- the creation of complete communities
- the efficient use of existing and new infrastructure.
These objectives take on added importance with the planned investment of billions of dollars on new regional transit infrastructure. The success of this investment will depend upon achieving a regional structure and urban form that attract large numbers of new riders to transit.
With so much at stake, it is critical to ensure that the policies and objectives of the Growth Plan are grounded in the reality of a transforming regional economy. Other regions show the potential downside of ignoring the connections between planning and the regional economy. For example, with its sprawling development pattern, Silicon Valley is essentially built out to the point at which growing firms like Google are having difficulty finding space to expand. The lack of affordable housing also creates a barrier to attracting the young talent that drives the computer and software industry there. This situation threatens the continued development of that economically dynamic region (Brown, 2015).
At the same time, an important opportunity has been emerging with the growth of knowledge-intensive activities. Not only is economic activity more focused on cities as sites for the production of goods and services, but urban and regional environments contribute directly to the competitiveness of individual businesses and of the region as a whole. Currently, the main policies in the Growth Plan[13] that explicitly address competitiveness are those relating to the land supply - that is, policies both to provide land for growing employment uses, and to preserve existing employment areas for future economic opportunities. As we shall see, the changing economic context provides for a much broader and stronger role for planning to support regional competitiveness and prosperity.
Research questions
This report therefore addresses two questions:
- How is the GGH economy changing, and what are the implications of its emerging geography for the Growth Plan policies and spatial vision?
- How can the Growth Plan support the economic competitiveness and prosperity of the Greater Golden Horseshoe?
This report builds on the limited research that has been done on the evolving economy of the Toronto region, including previous Neptis Foundation research (Canadian Urban Institute, 2011; Gertler, 2000, 2003; GHK, 2009; Ministry of Public Infrastructure Renewal, 2008; Strategic Regional Research, 2013).
URBAN AND REGIONAL ENVIRONMENTS CONTRIBUTE DIRECTLY TO THE COMPETITIVENESS OF INDIVIDUAL BUSINESSES AND OF THE REGION AS A WHOLE.
[1] In this section we include data for Ontario to show long-term employment trends, and for GDP because detailed sectoral data is not available at the metropolitan level. However, given the prominence of the GGH region in the Ontario economy, we can assume that provincial trends are indicative of regional trends.
[2] Statistics Canada, CanSIM 282-0008: Labour Force Survey Estimates (LFS), by North American Industry Classification System (NAICS), Sex and Age Group, Annual.
[3] All employment figures for Ontario from Statistics Canada, CanSIM Table 282-0008, as above.
[4] Sources for this and all other figures are found in Appendix 3.
[5] NAICS 31-33.
[6] All GDP figures in this section from Statistics Canada, CanSIM Table 379-0030, Gross domestic product at basic prices, by North American Industry Classification System (NAICS), provinces and territories, annual. All figures are in constant 2007 dollars.
[7] Statistics Canada, CanSIM Table 379-0030, Gross domestic product at basic prices, by North American Industry Classification System (NAICS), provinces and territories, annual. Selected industries, based on GDP growth above the provincial average for services or manufacturing as a whole, 2001-2013.
[8] NAICS 5613, 5614, 5615.
[9] 7% growth for NAICS 5611.
[10] Statistics Canada, Labour Force Survey, 2001 and 2014.
[11] Statistics Canada, Labour Force Survey, 2001 and 2014.
[12] Statistics Canada, Labour Force Survey.
[13] Appendix 1 contains a summary of Growth Plan policies related to employment and the economy.