As the economy evolves under globalization, we see a concentrating effect. This takes many forms, for example, a concentration of wealth in the highest income groups. Spatially, there is a concentration of certain economic activities in cities, especially in the largest cities and city-regions. For example, the share of Canada's population found in the five largest city-regions has increased from 25% in 1951 to 40% in 2006 (Bourne et al., 2011). This means that the GGH as a whole can expect its economic pre-eminence in the country to consolidate further as globalization proceeds.
At the same time, new spatial patterns are emerging within cities and city-regions, related to globalization and technological change and the economic restructuring those drivers are bringing about.
Spatial patterns vary with the type of economic activity
Different economic activities exhibit different spatial patterns of change within the region. These patterns depend upon their current geography, how those activities experience the pressures of global competition and technological change (for example, whether they are routine or knowledge-intensive), and at what stage they are in the restructuring process.
So the changing geography of the GGH can be understood as the layering of distinct spatial patterns of different types of economic activity. Below, we illustrate some of these layers by exploring recent patterns of employment change for key economic activities - one occupational grouping ("STEM," or science, technology, engineering and mathematics employment) and two industry sectors (finance and manufacturing). Each has its own unique geography. We present a selection of maps here to illustrate the diversity of spatial patterns; maps for other sectors are in Appendix B.
A note on mapping:
In interpreting the maps, note that the dots representing employment do not correspond to a specific point location but to census tracts. Each dot represents 100 jobs and is randomly located within the census tract to which it applies. The boundaries of the census tracts are not shown in order to illustrate other data layers more clearly.
STEM employment
STEM occupations include professionals and technicians in science, technology, engineering, and mathematics.[1] These are among the jobs driving the successful transformation of the GGH to a knowledge-based economy. All STEM jobs are considered to be high-skilled or skilled. Figure 4 shows that STEM jobs have increased by 26% since 2001 (an increase of about 75,000 jobs) compared with 21% for the economy as a whole.[2]
Figure 4: Change in GGH Employment 2001-2014, Total Employment and STEM (%)

STEM employment exhibits a particular geography, focusing on a few locations in the GGH (Map 1). There is a significant, extremely dense concentration in Downtown Toronto.[3] Other important concentrations are found in suburban business parks: the Airport Corporate Centre area and Meadowvale in Mississauga, around the 404/407 highway interchange to the northeast of Toronto, Sheridan Business Park in Oakville, and in the City of Waterloo.

Map 1: STEM Employment, 2011
In recent years, STEM job growth has been increasing in these suburban business parks, along with Downtown Toronto (Map 2). There are also areas of STEM job loss, including older corporate campuses in Toronto's postwar inner suburbs, such as the Don Mills and Eglinton area.

Map 2: STEM Employment change, 2001-2011
The finance sector
Between 2001 and 2014, employment in the finance sector grew by about 40% versus 20% of all employment growth for the GGH[4] (Figure 5).
Job growth in finance has occurred in Downtown Toronto, as well as suburban business parks such as Meadowvale and Airport Corporate Centre, and the 404/407 highway interchange (Map 3). There are also areas of job loss, such as Scarborough City Centre, and parts of Downtown Toronto, too. This pattern is related to the loss of routine finance jobs. All of the 90,000 new jobs in the finance sector were high-skilled or skilled. Low-skilled finance jobs experienced a loss of 2,000 positions.[5]
 Figure 5: Change in GGH Employment, 2001-2014, Total Employment and Finance (%)

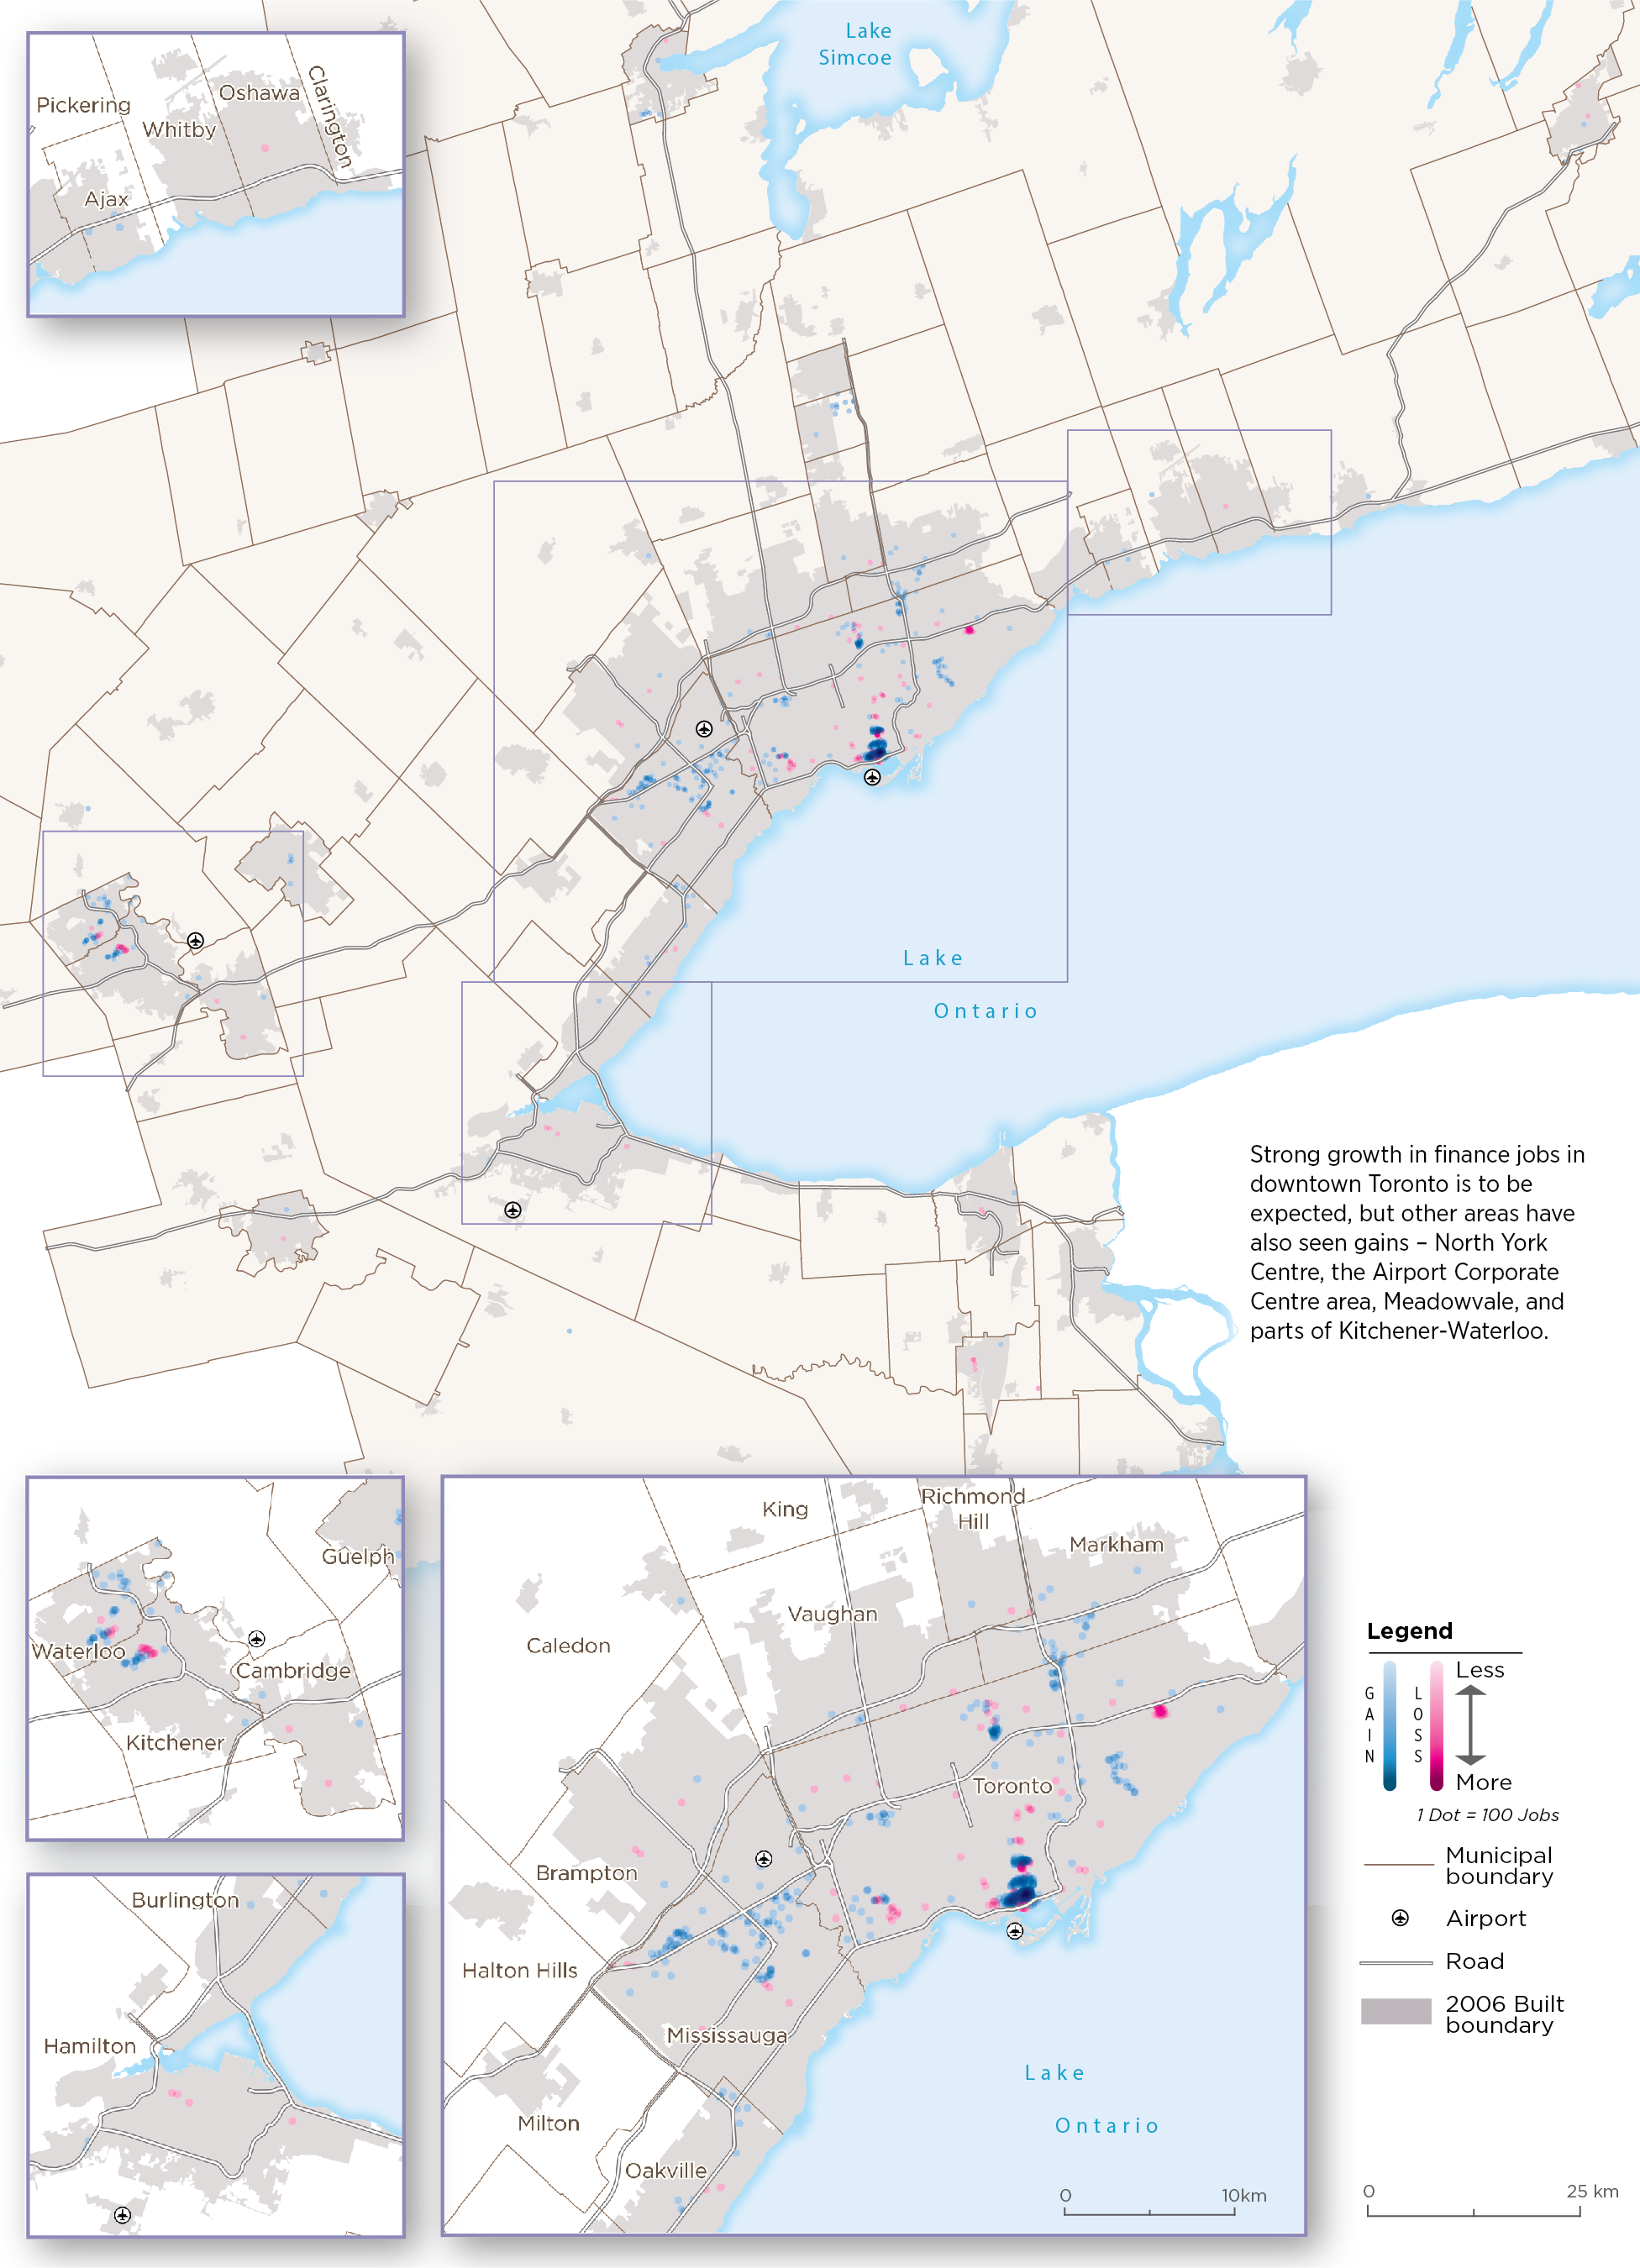
Map 3: Employment change in finance, 2001-2011
Employment in the finance sector has a strong tendency to concentrate. This is not surprising, given that the sector is heavily weighted towards knowledge-intensive activities, in a fast-paced and volatile sector that relies on formal and informal knowledge flows in a dense environment.
The current pattern of employment (Map 4) shows some locations of finance employment outside Toronto's financial district - along the Yonge subway line, or in some suburban business parks. But Toronto's financial district remains the dense, dominant centre of the industry.

Map 4: Employment in finance, 2011
Manufacturing employment
Despite the significant job and business losses of the last decades, manufacturing retains a strong presence and economic role in the GGH, accounting for about 500,000 jobs in 2014.[6] The region lost almost 200,000 manufacturing jobs between 2001 and 2014, but this is a net number, so there was also some growth, albeit small, in a few categories, such as beverages, bakeries, meat products, and aerospace. This employment growth can be found mostly scattered in the newer employment areas, such as the western reaches of Mississauga and in Waterloo.
Nevertheless, the dominant pattern is that of widespread employment loss across the GGH. Jobs were lost across all skill levels, but more than half of the loss was in routine jobs. About 115,000 of the almost 200,000 manufacturing jobs lost between 2001 and 2014 were in the low-skilled, "C" category.[7] The job loss was also felt across the spectrum of manufacturing.[8] Figure 6 shows the change in percentage terms in employment in that sector between 2001 and 2014 relative to all GGH employment.[9]
 Figure 6: Change in GGH Employment 2001-2014, Total Employment and Manufacturing (%)

Manufacturing tends to locate along major expressways, such as Highways 401 and 407 and the Queen Elizabeth Way, and near intermodal terminals. Significant areas of manufacturing employment are found around Pearson International Airport, the Highway 400 corridor in Vaughan, and the interchange of Highways 404 and 407 (Map 5).

Map 5: Employment in manufacturing, 2011
Map 6 shows how employment change in the manufacturing sector from 2001 to 2011 has played out geographically. Areas of job loss tend to be found mostly in the older industrial areas - in Toronto's inner suburbs, along the lakeshore, and in cities like Hamilton and Oshawa.

Map 6: Employment change in manufacturing, 2001-2011
The geography of core employment
Map 7 shows the change in core employment between 2001 and 2011. This is employment that draws or has the potential to draw income into the economy; it excludes population-related employment such as retailing, personal services, food services, religious organizations, and local schools. [10]

Map 7: Change in core employment, 2001-2011
The map shows intense job growth (shown in blue) focusing on the centre of the City of Toronto, as well as considerable growth in the suburban business parks in Mississauga and around the 404/407 highway interchange in Markham and northeast Toronto. There is also a notable concentration of growth in the City of Waterloo.
Not all growth is concentrated, however. Much of the employment gains have occurred in a suburban arc from Halton Region in the west to Durham Region in the east, in newly urbanized areas at the edges of the built-up area. This growth includes a fair amount of dispersed employment. As there has been very little manufacturing employment growth in the region, this dispersed growth likely represents jobs in warehousing and distribution (particularly jobs located near the multi-modal terminals in Brampton and Vaughan), or construction.
For the most part, job growth has not replaced loss (shown in red) in older urbanized areas across the region. Most municipalities experienced a combination of growth in some areas (mostly outer suburban), and loss in others (mostly urban or inner suburban). And a few municipalities experienced relatively little growth, while sustaining significant job losses (for example, the cities of Oshawa, St. Catharines, and Hamilton).
Mapping core employment as a whole provides an overall picture of employment change in the GGH. However, it also obscures diverse patterns of employment change related to different types of economic activity.
As we have seen, manufacturing has experienced substantial job loss, especially in routine activities. These losses have occurred mainly in the older industrial areas across the GGH. Meanwhile, STEM and finance employment has demonstrated strong growth, especially in Downtown Toronto and certain suburban business parks. Appendix B contains maps showing the geographical patterns of other sectors and employment types.
Some of the key overall patterns of employment change reflected in the mapping are:
- the concentration of knowledge-intensive activities in Downtown Toronto
- the suburbanization of some knowledge-intensive activities in corporate suburban business parks
- the dispersal of non-manufacturing industrial uses such as warehousing and distribution to suburban industrial areas
- job loss in older industrial and inner suburban areas.
This kind of analysis, which considers the dynamics of regional economic change, rather than simply extrapolating trend lines, will help us better understand where growth pressures might be and where decline might take place in future, and in relation to what kinds of economic activity. That is, it provides the detailed information needed for effective planning.
This brings us to the overall picture of the geography of employment in the GGH. The distribution of core employment in the GGH in 2011 is shown in Map 8.

Map 8: Core employment, 2011
The region has a clear, dominant, and dense employment district in the centre of the City of Toronto. Other dense concentrations of employment in the city include North York City Centre, the Yonge-Eglinton area, Consumers Road (near the intersection of Highways 401 and 404), as well as in the centres of older cities such as Kitchener, Waterloo, and Hamilton.
The map also shows three extensive employment zones, clearly related to the 400-series expressways: one surrounding Pearson International Airport, one in the area surrounding the 404/407 highway interchange, and a third straddling the boundaries of Vaughan and Toronto along the southern extent of Highway 400.
Otherwise, GGH core employment is found in suburban employment areas associated with the expressway network, such as those in Toronto along the Don Valley Parkway and in Oakville along the Queen Elizabeth Way.
The maps also indicate the impact of the 400-series highways on the evolving employment geography of the region. The 407 corridor, for example, has attracted significant amounts of STEM jobs and office employment in the finance sector, along with industrial employment.
Table 1 summarizes some of the key changes and shifts in the regional economic geography.
Table 1: Greater Golden Horseshoe, 2011 employment and 2001-2011 employment change[11]
Core employment, 2011 (% of GGH) | Core employment change 2001-2011 (%) | All employment, 2011 (% of GGH) | All employment change 2001-2011 (%) | |||||
Inner Ring (GTHA) | 1,755,900 | 80% | 4,050 | 0.2% | 2,759,300 | 78% | 238,070 | 9% |
Downtown Toronto | 385,490 | 18% | 42,290 | 12% | 464,650 | 13% | 48,120 | 12% |
Toronto (without Downtown) | 487,240 | 22% | -63,380 | -12% | 826,070 | 23% | -11,170 | -1% |
905 (Inner Ring without Toronto) | 883,170 | 40% | 25,140 | 3% | 1,468,580 | 42% | 201,120 | 16% |
Outer Ring | 442,660 | 20% | -7,160 | -2% | 779,600 | 22% | 69,450 | 10% |
GGH | 2,198,560 | 100% | -3,110 | 0% | 3,538,900 | 100% | 307,520 | 10% |
For the region as a whole, core employment shows a net loss of some 3,000 jobs, mainly owing to the decline of manufacturing employment, which outweighs job growth in other core activities such as finance, government, logistics, and business services.
The implications of this employment geography for the region's spatial economic structure are addressed in the next section.
[1] STEM jobs do not include teachers or university professors in those fields. The classification is based on occupations, not employers, and these jobs are found in various sectors, including manufacturing and services.
[2] Statistics Canada, Labour Force Survey.
[3] In this report, we use the name of the Urban Growth Centre designated in the Growth Plan to indicate the central business district of Toronto, known elsewhere as the "Toronto core," in order to avoid confusion with the term "core employment."
[4] Statistics Canada, Labour Force Survey.
[5] Statistics Canada, Labour Force Survey.
[6] Statistics Canada, Labour Force Survey,.
[7] Statistics Canada, Labour Force Survey.
[8] Based on Statistics Canada's Labour Force Surveys, 2001-2014.
[9] Statistics Canada, Labour Force Survey.
[10] Population-related or "local services" dependent on core economic activities, as expected, are scattered across the region more or less evenly. See Appendix B, Map A9. The composition of core employment is detailed in Appendix C.
[11] The figures in the table represent jobs with a usual place of work only. "Outer Ring" and "Inner Ring" correspond to areas defined in the Growth Plan: the Inner Ring is the Greater Toronto and Hamilton Area and the Outer Ring is the area beyond that, outside the Greenbelt.