The Higher Education Archetype comprises employment in universities and community colleges. As of 2016, this Archetype represented 65,000 jobs in the GGH. This is a fast-growth Archetype, adding more than 18,000 jobs since 2006, a 31 percent increase. Given the important role of institutions of higher learning in a knowledge-based economy, this employment growth is expected.
Table 15: Higher Education Archetype Employment, GGH, 2006 and 2016
| 2006 | 2016 | Change | % Change |
Higher Education | 59,635 | 78,100 | 18,465 | 31.0 |
Archetypes total | 1,481,595 | 1,459,825 | -21,770 | -1.5 |
Total GGH core employment | 2,300,015 | 2,375,465 | 75,450 | 3.3 |
Total GGH employment | 3,437,935 | 3,710,915 | 272,980 | 7.9 |
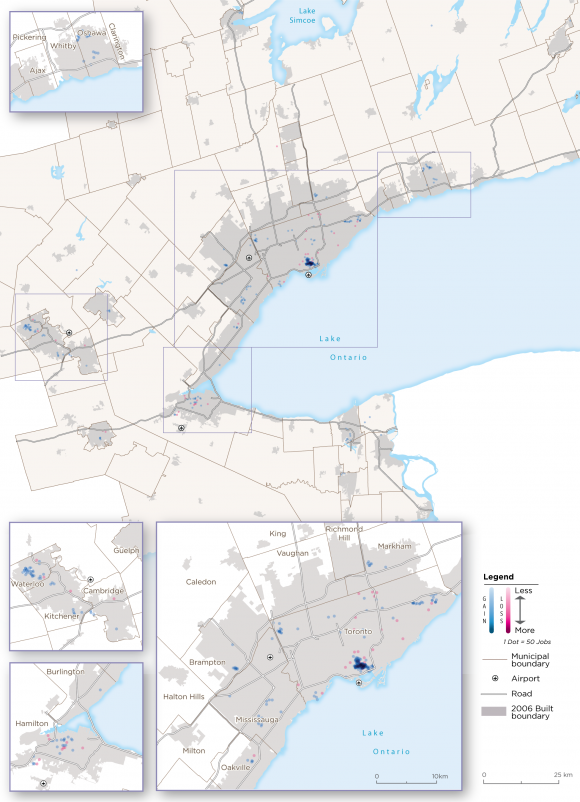
Not surprisingly, the geography of Higher Education employment in the GGH corresponds to the locations of institutions of higher learning, including the University of Toronto, York, Ryerson, McMaster, UOIT, Guelph, and Waterloo.
These locations are of strategic importance, given growing partnerships between universities, community colleges, businesses, and non-profit groups, as well as the institutions' roles as sites of business incubators, innovation, research, and development. (See Maps 19 and 20.)

Map 19: Higher Education Archetype Employment, GGH, 2016

Map 20: Higher Education Employment Change, GGH, 2006-2016
