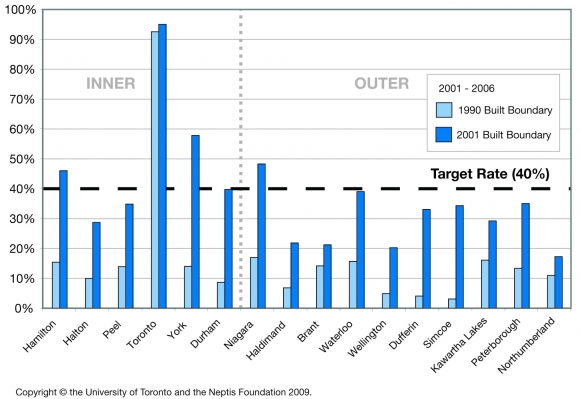
We delineated a built boundary for 2001 from satellite imagery and measured intensification within it for the five-year period from 2001 to 2006. In other words, we increased the amount of urban land in the land base used to measure intensification. Then we calculated the percentage of all development built between 2001 and 2006 located within this line. Figure 13 compares the five-year intensification rates for the Greater Golden Horseshoe measured within the 1990 built boundary and the 2001 built boundary.
The difference between the two rates is mainly attributable to intensification near the urban edge. As the boundary moves out, more land is taken in and more holes at the edge are included in the land base. The results show that any movement of the built boundary would have to account for this edge effect, which is the product of the urban development process. Also, since the purpose of meeting targets is to achieve broader policy goals, moving the boundary might defeat this purpose; that is, by making it easier for municipalities to achieve the target (40% intensification rate), the province would not help the region achieve the goals of the policy.

