We followed the two-step process, defining a built boundary line and counting newly constructed dwelling units inside and outside that line. Because we started this research before the Province released details of its method for deriving a built boundary, we needed to find data that would enable us to identify a built boundary in the past and to count dwelling units. We chose to use satellite imagery for identifying a built boundary and census data to count dwelling units.
We quickly realized that the simple concept of defining a built boundary becomes complicated when put into practice.
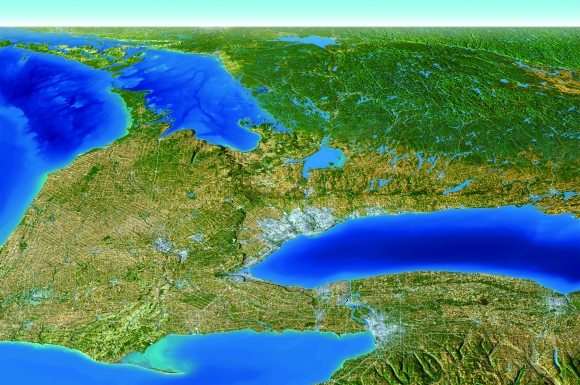
Figure 3: Southern Ontario
Figure 3 shows a view of the Toronto region from space.11 Urban areas are shown in a whitish-grey colour. We have enhanced the topography to give the image a three-dimensional quality and to highlight natural features in the image, so that greenlands in Ontario and the relative depths of the Great Lakes are visible. The agricultural lands are difficult to see at this scale, but as we zoom in closer, they appear as rectangular shapes that can be shades of green, brown, or yellow. The urban region looks quite clear from this scale, and it appears as if drawing a line around the urban areas will be reasonably straightforward.
Figure 4: Zooming into Waterloo Region
Figures 4a and 4b, which also use satellite imagery, show the western edge of the region covering the Waterloo-Kitchener-Cambridge and Guelph area, where urban areas are surrounded mainly by agricultural fields. In Figure 4a, the delineation of urban is still fairly clear, although ribbons of greenlands begin to complicate the urban footprint. However, in Figure 4b, the difficulty of separating urban from non-urban becomes more apparent.
Figure 4c is an aerial photograph that offers a more detailed picture of the outer extent of the urban area of Kitchener. If we equate "urban" with "built" and "non-urban" with "unbuilt," it is clear that the built area contains many pockets of unbuilt land and the rural or non-urban area contains many built elements.
These ambiguities at the edge of an urbanized area are largely the product of the development process, whereby land use changes over time, sometimes over a long period of time. The process begins when an official plan and its zoning by-laws identify the land as suitable for development. This policy change is followed by development applications, usually further amendments to the plan, delays in securing financing for development or necessary approvals, fluctuations in market demand, and eventually the construction of houses, roads, and other urban features. This process from beginning to end can take many years before the land at the urban edge is completely developed.
The process is visible in the landscape. Figure 4c shows small pockets of undeveloped land at the near edge of the built boundary. Some may be parks or greenlands, but others are vacant land surrounded by built land. Many of these small pockets are areas where development has been delayed for some reason. This is not "leapfrog" development, just an artefact of normal urban expansion.
Since the size and number of these pockets varies greatly across the region, drawing a line around the urban area represents a real challenge. Nevertheless, over the course of four years of research, in a collaboration between Neptis and the Cartography Office in the Department of Geography at the University of Toronto, we have developed a method that takes these challenges into account and can produce a built boundary for any given year and for any urban region for which high-quality satellite imagery is available.12 We have now produced a time series of urban area data sets to study the extent and amount of urban growth in the Toronto Region well as other urban regions in Canada.13


