Good data are available on Ontario's energy use, although not on use within the Central Ontario Zone. It's likely that the patterns of energy consumption in the Central Ontario Zone are similar to those for the whole of Ontario, chiefly because about two thirds of Ontario residents live in the Zone and a higher proportion of business activity is located there. The main differences in patterns of energy between the Central Ontario Zone and the rest of Ontario likely result from the Zone's generally milder climate and the greater presence of the commercial sector in the Zone. The latter factor may be offset by the greater concentration in the rest of Ontario of energy-intensive industries, notably steel, nickel, and copper production.
The key Ontario trends are shown in Figure 1.3 "Other fuels" are mostly coal and related fuels used directly by industry
Figure 1: End-use energy consumption in petajoules, 1990-2000
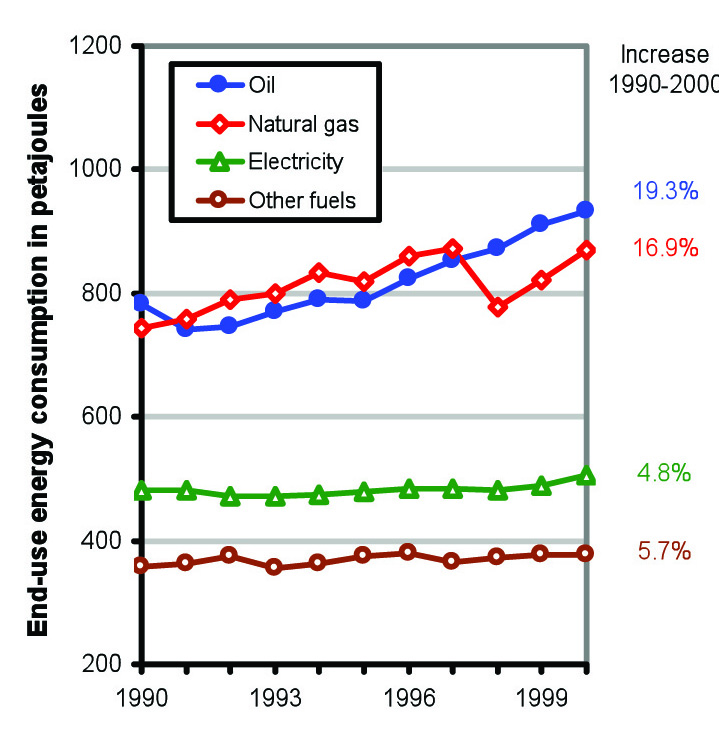
Between 1990 and 2000, the last year for which complete Ontario data are available, overall energy use increased from 2,367 to 2,687 petajoules,4 i.e. by 13.5%. Oil use increased at a higher rate, but natural gas use was increasing even more quickly until the warmer winters of the late 1990s curbed demand. Meanwhile, population grew by 13.6%.5
Table 1 shows how the various fuels were used in 2000.6 Oil was used mostly for transportation; "other fuels" were used mostly for industry. Natural gas and electricity were each shared somewhat evenly among the industrial, residential, and commercial sectors. Overall, industry was the biggest user of energy--32.9% of total use--with transportation close behind.
Table 1. End use of energy in Ontario by sector, 2000
|
|
Agriculture |
Industry |
Commercial |
Residential |
Transport |
Total |
|
Oil |
3.5% |
6.3% |
2.3% |
3.6% |
84.3% |
100.0% |
|
Natural gas |
1.3% |
36.9% |
25.3% |
36.2% |
0.2% |
100.0% |
|
Electricity |
1.7% |
33.0% |
34.6% |
30.4% |
0.3% |
100.0% |
|
Other fuels |
0.4% |
89.5% |
2.4% |
6.4% |
1.3% |
100.0% |
|
All fuels |
2.0% |
32.9% |
15.9% |
19.6% |
29.6% |
100.0% |
End uses are shown in Figure 1 and Table 1, i.e., the energy content of the fuels actually used in cars, furnaces, machines, and light bulbs. If energy supply is being considered, the fuels used to generate electricity must be taken into account. In 1999, 43% was produced from nuclear energy and 24% from hydroelectric sources. Thermal generation produced the remainder with 24% of the total amount generated coming from coal, 7% from natural gas, and 2% from oil.7 Thus, when electricity production is taken into account, the 1999 totals for oil and natural gas use in Ontario were a little higher and closer together than is indicated in Figure 1, and the total for coal (within "other fuels") was quite a bit higher.
Figure 2 shows that during the 1990s in-building uses and transportation gained on industry as the major user of energy in Ontario.8 Energy use for freight transport grew at a particularly high rate (44.9% over the ten years), but movement of people used more energy. Energy use for agriculture also increased substantially, but from a small base.
Figure 2. End use of energy in Ontario by sector, 1990-2000

In 2000, space heating and cooling comprised about 60% of the energy use by each of the commercial and residential sectors in Ontario. In total, space heating and cooling consumed 566 petajoules of energy, somewhat more than the 479 petajoules used for moving people.