Housing market activity is cyclical. Within that cycle of activity there is also a cycle in terms of the mix of housing by dwelling types. This section explores the variation in the mix of housing starts by dwelling type over the past 18 years in the GTA.
Table 6 shows annual housing starts by type from 1987 to 2004 and averages for four sub-periods:
- the "boom" years of 1987 to 1989;
- the recessionary period of 1990 to 1995;
- the beginning of the recovery during 1996 to 1998;
- the strong market period of 1999 to 2004.
Table 6: Housing Starts by Dwelling Type in the GTA, 1987 to 2004 (in units)
Year | Single Detached | Semi-Detached | Row/Town House | Apartment | Total |
1987 | 31,005 | 832 | 3,079 | 16,675 | 51,591 |
1988 | 22,817 | 459 | 3,092 | 17,373 | 43,741 |
1989 | 19,538 | 208 | 2,732 | 16,988 | 39,466 |
1990 | 8,518 | 236 | 2,396 | 10,081 | 21,231 |
1991 | 10,731 | 249 | 3,627 | 7,146 | 21,753 |
1992 | 9,814 | 954 | 3,114 | 9,417 | 23,299 |
1993 | 8,998 | 924 | 2,577 | 5,001 | 17,500 |
1994 | 11,962 | 1,467 | 3,227 | 3,723 | 20,379 |
1995 | 7,878 | 914 | 3,686 | 5,386 | 17,864 |
1996 | 11,408 | 1,664 | 4,727 | 3,286 | 21,085 |
1997 | 16,433 | 2,811 | 6,177 | 3,427 | 28,848 |
1998 | 14,220 | 3,388 | 6,316 | 4,939 | 28,863 |
1999 | 17,584 | 5,091 | 6,354 | 9,512 | 38,541 |
2000 | 19,474 | 5,760 | 6,958 | 10,369 | 42,561 |
2001 | 19,147 | 5,766 | 5,806 | 13,901 | 44,620 |
2002 | 25,319 | 5,358 | 7,235 | 10,375 | 48,287 |
2003 | 22,772 | 5,024 | 6,867 | 15,545 | 50,208 |
2004 | 21,593 | 3,668 | 6,744 | 14,367 | 46,372 |
Averages |
|
|
|
|
|
1987-1989 | 24,453 | 500 | 2,968 | 17,012 | 44,933 |
1990-1995 | 9,650 | 791 | 3,105 | 6,792 | 20,338 |
1996-1998 | 14,020 | 2,621 | 5,740 | 3,884 | 26,265 |
1999-2004 | 20,982 | 5,111 | 6,661 | 12,345 | 45,098 |
Entire Period | 16,623 | 2,487 | 4,706 | 9,862 | 33,678 |
Source: Canada Mortgage and Housing Corporation
Table 7 shows the percentage shares of housing starts by year and for the sub-periods. The data indicate that over the entire period, single detached houses have accounted for just under half (49.4 percent) of housing starts in the GTA; semi-detached houses have accounted for less than one-tenth of starts (7.4 percent); 14.0 percent of starts have been townhouses, and 29.3 percent have been apartments. The shares have varied during the period.
Table 7: Housing Starts by Dwelling Type in the GTA, 1987 to 2004 (percentages)
Year | % Shares by Dwelling Type | ||||
Single Detached (%) | Semi-Detached (%) | Row/Town House (%) | Apartment (%) | Total Units | |
1987 | 60.1 | 1.6 | 6.0 | 32.3 | 51,591 |
1988 | 52.2 | 1.0 | 7.1 | 39.7 | 43,741 |
1989 | 49.5 | 0.5 | 6.9 | 43.0 | 39,466 |
1990 | 40.1 | 1.1 | 11.3 | 47.5 | 21,231 |
1991 | 49.3 | 1.1 | 16.7 | 32.9 | 21,753 |
1992 | 42.1 | 4.1 | 13.4 | 40.4 | 23,299 |
1993 | 51.4 | 5.3 | 14.7 | 28.6 | 17,500 |
1994 | 58.7 | 7.2 | 15.8 | 18.3 | 20,379 |
1995 | 44.1 | 5.1 | 20.6 | 30.2 | 17,864 |
1996 | 54.1 | 7.9 | 22.4 | 15.6 | 21,085 |
1997 | 57.0 | 9.7 | 21.4 | 11.9 | 28,848 |
1998 | 49.3 | 11.7 | 21.9 | 17.1 | 28,863 |
1999 | 45.6 | 13.2 | 16.5 | 24.7 | 38,541 |
2000 | 45.8 | 13.5 | 16.3 | 24.4 | 42,561 |
2001 | 42.9 | 12.9 | 13.0 | 31.2 | 44,620 |
2002 | 52.4 | 11.1 | 15.0 | 21.5 | 48,287 |
2003 | 45.4 | 10.0 | 13.7 | 31.0 | 50,208 |
2004 | 46.6 | 7.9 | 14.5 | 31.0 | 46,372 |
Averages |
|
|
|
|
|
1987-1989 | 54.4 | 1.1 | 6.6 | 37.9 | 44,933 |
1990-1995 | 47.4 | 3.9 | 15.3 | 33.4 | 20,338 |
1996-1998 | 53.4 | 10.0 | 21.9 | 14.8 | 26,265 |
1999-2004 | 46.5 | 11.3 | 14.8 | 27.4 | 45,098 |
Entire Period | 49.4 | 7.4 | 14.0 | 29.3 | 33,678 |
Source: Canada Mortgage and Housing Corporation; calculations by Will Dunning Inc.
During about half of this 18-year period, assisted rental housing development contributed many units. Since the mix of dwelling types constructed under the assisted housing programs may not reflect the housing type preferences of the population, Table 8 shows the shares of housing by type, excluding assisted housing units.
If assisted housing units are excluded, over the last 18 years, single detached houses have accounted for just over half (52.6 percent) of housing starts in the GTA; apartments for slightly over one-quarter; semi-detached houses less than one-tenth (7.9 percent), and row housing units slightly more than one-tenth (13.9 percent). The shares have shifted over time.
- The share of apartments has been higher in the strong market periods (1987-1989 and 1999-2004) and lower in weaker markets (1990-1995 and 1996-1998).
- The share for single detached houses has fallen over the past decade and a half. During the recent strong housing market, singles have accounted for less than one-half of starts.
- Semi-detached houses were a small minority of starts until 1992, when the share began to increase. It peaked in 2000 and has since declined. That declining share coincides with increased apartment activity.
- Similarly, the share for row housing units was higher in the second half of the 1990s than in the first half. In recent years, row houses have lost share as apartment activity has expanded.
Table 8: Housing Starts by Dwelling Type in the GTA, Excluding Assisted Housing, 1987 to 2004 (percentages)
Year | % Shares by Dwelling Type | ||||
Single Detached (%) | Semi-Detached (%) | Row/Town House (%) | Apartment | Total Unassisted Units | |
1987 | 63.5 | 1.7 | 5.0 | 29.8 | 48,796 |
1988 | 55.3 | 1.1 | 6.9 | 36.6 | 41,228 |
1989 | 53.8 | 0.6 | 5.9 | 39.7 | 36,318 |
1990 | 45.4 | 1.3 | 11.2 | 42.1 | 18,757 |
1991 | 70.0 | 1.6 | 13.0 | 15.3 | 15,322 |
1992 | 71.5 | 7.0 | 12.1 | 9.5 | 13,724 |
1993 | 68.8 | 7.1 | 15.8 | 8.3 | 13,079 |
1994 | 67.3 | 8.3 | 16.7 | 7.8 | 17,771 |
1995 | 49.6 | 5.8 | 22.6 | 22.0 | 15,879 |
1996 | 56.2 | 8.2 | 23.2 | 12.4 | 20,303 |
1997 | 57.0 | 9.7 | 21.4 | 11.9 | 28,848 |
1998 | 49.3 | 11.7 | 21.9 | 17.1 | 28,863 |
1999 | 45.6 | 13.2 | 16.5 | 24.7 | 38,541 |
2000 | 45.8 | 13.5 | 16.3 | 24.4 | 42,561 |
2001 | 42.9 | 12.9 | 13.0 | 31.2 | 44,620 |
2002 | 52.6 | 11.1 | 15.0 | 21.2 | 48,119 |
2003 | 45.4 | 10.0 | 13.7 | 30.9 | 50,176 |
2004 | 46.8 | 8.0 | 14.6 | 30.6 | 46,124 |
Averages |
|
|
|
|
|
1987-1989 | 58.1 | 1.2 | 5.9 | 34.9 | 42,114 |
1990-1995 | 61.3 | 5.0 | 15.2 | 18.5 | 15,755 |
1996-1998 | 53.9 | 10.1 | 22.0 | 14.0 | 26,005 |
1999-2004 | 46.6 | 11.4 | 14.8 | 27.3 | 45,024 |
Entire Period | 52.6 | 7.9 | 13.9 | 25.7 | 31,613 |
Source: Canada Mortgage and Housing Corporation; calculations by Will Dunning Inc.
If all purpose-built rental units are excluded, and only homeowner units counted, a similar pattern emerges:
- The share for single detached houses has fallen, and is below 50 percent in the most recent period.
- The share of apartments has been highest during strong markets.
- Semi-detached and row houses gained market share during the 18-year period, but this trend has been reversed as apartments have gained market share.
Table 9: Housing Starts by Dwelling Type in the GTA, Including Only Units Intended for Homeownership, 1987 to 2004 (percentages)
Year | Shares by Dwelling Type | ||||
Single Detached (%) | Semi-Detached (%) | Row/Town House (%) | Apartment (%) | Total Ownership Units | |
1987 | 66.1 | 1.8 | 4.6 | 27.6 | 46,927 |
1988 | 59.5 | 1.2 | 7.3 | 32.0 | 38,316 |
1989 | 56.2 | 0.6 | 6.0 | 37.2 | 34,775 |
1990 | 51.9 | 1.4 | 9.8 | 36.9 | 16,414 |
1991 | 71.1 | 1.6 | 13.1 | 14.1 | 15,097 |
1992 | 74.7 | 7.3 | 12.6 | 5.5 | 13,135 |
1993 | 70.4 | 7.2 | 16.2 | 6.2 | 12,788 |
1994 | 67.5 | 8.3 | 16.7 | 7.5 | 17,714 |
1995 | 49.7 | 5.8 | 22.6 | 21.9 | 15,859 |
1996 | 56.6 | 8.3 | 23.2 | 11.9 | 20,148 |
1997 | 57.5 | 9.8 | 21.6 | 11.1 | 28,596 |
1998 | 49.6 | 11.8 | 22.0 | 16.7 | 28,684 |
1999 | 46.2 | 13.4 | 16.4 | 24.0 | 38,045 |
2000 | 46.2 | 13.7 | 16.2 | 24.0 | 42,158 |
2001 | 43.9 | 13.2 | 12.8 | 30.1 | 43,642 |
2002 | 54.2 | 11.5 | 14.8 | 19.6 | 46,756 |
2003 | 47.5 | 10.5 | 14.0 | 28.1 | 47,989 |
2004 | 48.0 | 8.2 | 14.8 | 29.0 | 44,969 |
Averages |
|
|
|
|
|
1987-1989 | 61.1 | 1.2 | 5.9 | 31.8 | 40,006 |
1990-1995 | 63.6 | 5.2 | 15.2 | 15.9 | 15,168 |
1996-1998 | 54.3 | 10.2 | 22.1 | 13.4 | 25,809 |
1999-2004 | 47.8 | 11.6 | 14.8 | 25.8 | 43,927 |
Entire Period | 54.2 | 8.1 | 13.9 | 23.7 | 30,667 |
Source: Canada Mortgage and Housing Corporation; calculations by Will Dunning Inc.
The data indicate that market shares by dwelling type vary during the housing cycle, but do not show the mechanism that causes the variation. Figure 25 plots the percentage of the GTA's homeowner starts that are apartments against an estimate of the median price (adjusted for inflation) for single detached houses (using data from the Toronto Real Estate Board). During periods of high or rising house prices, the share for apartments tends to rise. In the late 1980s, a high price for single houses was associated with a high share for apartments. As the price of single houses fell during the first half of the 1990s, the share for apartments was lower. Since the mid 1990s, a rising price for singles has once again been associated with a rising market share for apartments.
Figure 25: GTA Homeowner Apartment Starts vs. GTA Single House Prices, 1988 to 2004
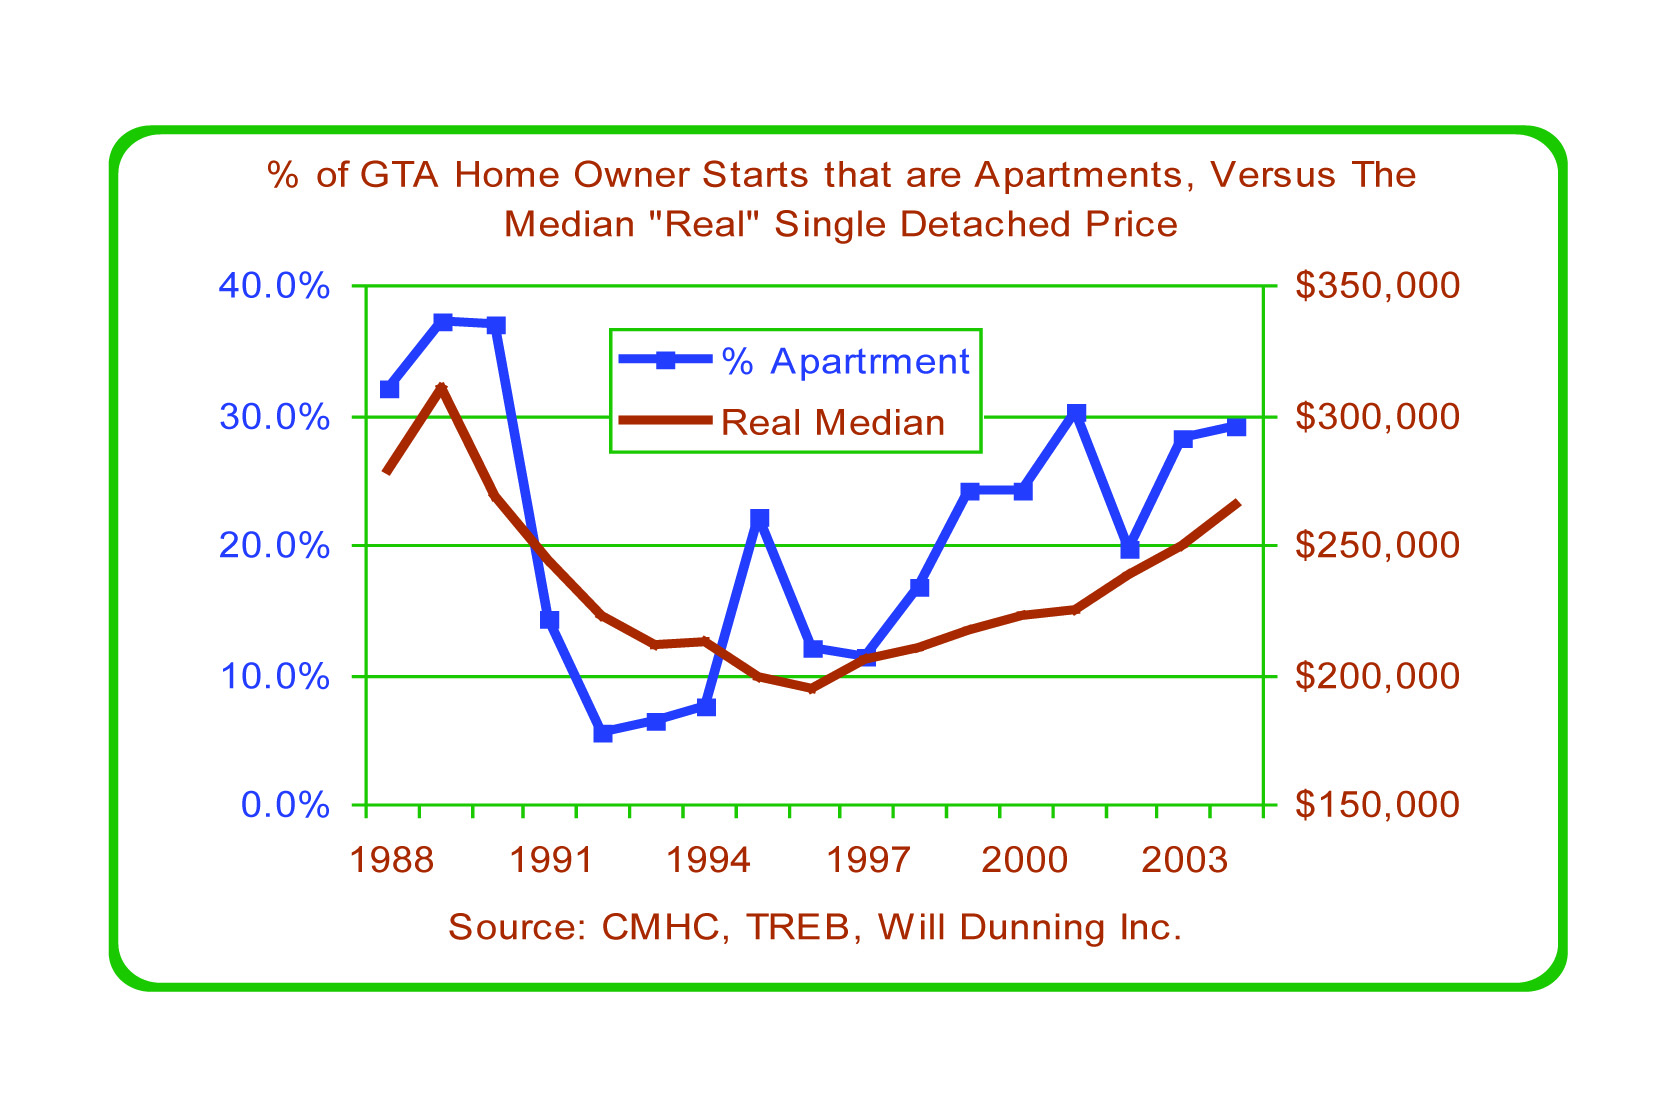
As house prices rise, more consumers choose to buy lower-cost apartments rather than expensive single detached houses. However, this is not the entire story. The share of apartments has been boosted by low interest rates, which have allowed thousands of renters to move from rental apartments to condominium apartments.
There is also an investment component in the condominium market, which is unlikely to be affected by the price of single detached houses. Many new condominium apartments are purchased by investors who offer them for rent. These apartments are leased on month-to-month or annual leases, similar to conventional rentals; some are available as furnished, short-term accommodation, and have more in common with hotels than with conventional rentals. For investment buying, the motivation is the expected return on investment. That return has two parts - the cash flow generated by the rents (minus costs) and capital gains (due to rising property values).
Although there is no precise data on the extent of investment activity in the new condominium market, informed observers believe that at present at least 25 percent of new condominium apartments are purchased by investors. The investor share varies over time and by location. There is undoubtedly a cyclical element to this investment activity, since investment vehicles come into and fall out of favour. Investment in condominiums was in favour during 2004 and 2005, but recent high levels of investment could be followed by a downturn precipitated by rising vacancies and weaker rents. This would contribute to a downturn in the sales cycle for condominium apartments.
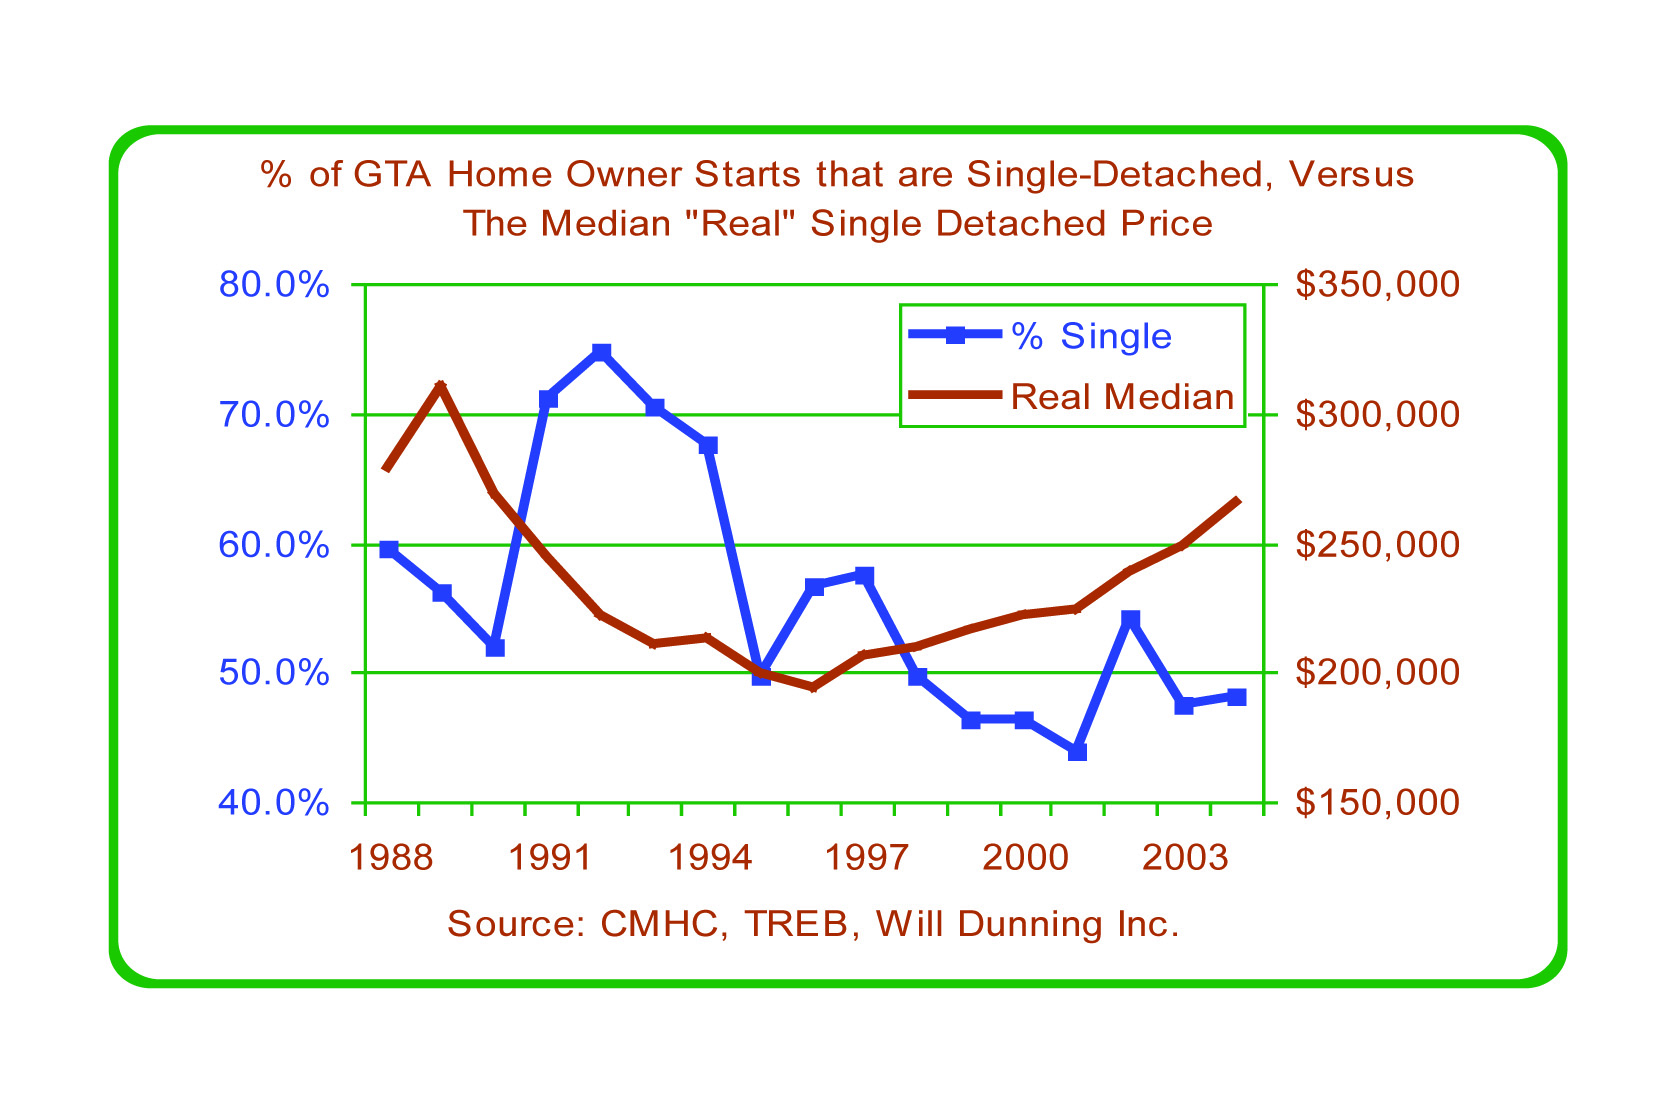
As shown in Figure 26, the share for singles has a weaker relationship to prices. During the early 1990s, the share rose as prices fell. But, from 1995 to 1997, the share fell, despite the reduced prices. Over the past seven years, as prices have increased in real terms, the share for singles has been below 50 percent in all but one year. During the first half of the 1990s, the share for singles exceeded 60 percent for four years and 70 percent for three years. This was during a period when the apartment market was suffering from the over-building of the 1980s, and when total housing starts were quite low. Actual starts of singles averaged only 10,376 units per year during those four years, well below the 18-year average of 16,623 units per year.
Figure 26: Percentage of GTA Single-Detached Homeowner Starts vs. Real Median Single Detached House Prices, 1988 to 2004
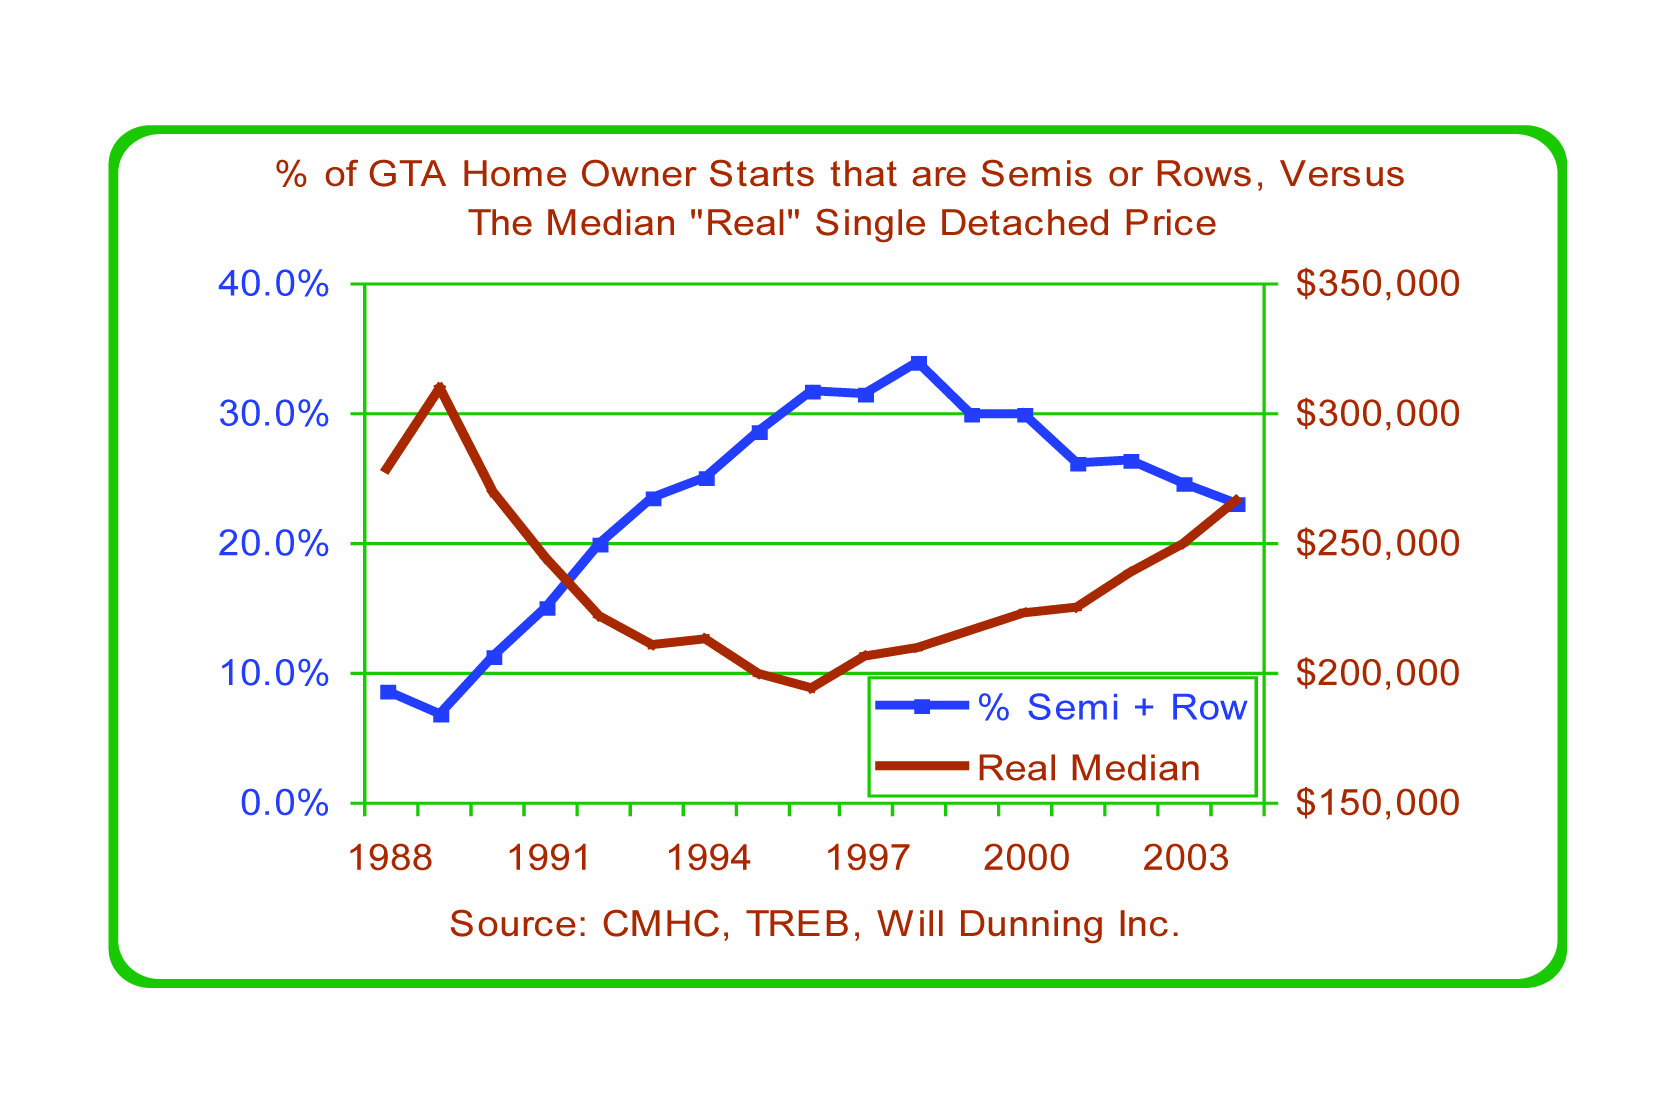
The loss of share by singles in the mid 1990s is also due to the increasing share for semi-detached and row units. Figure 27 shows the combined share for these two dwelling types, which increased from 1989 to 1998, but fell again as apartments gained share.
Figure 27: Percentage of GTA Homeowner Semi-Detached and Row Housing Starts vs. Real Median Single Detached House Prices, 1988 to 2004