A. 1 Projections of Migration by Components for 16 Census Divisions in the Greater Golden Horseshoe
Table A-1-1: Projections of Migration by Census Division in the Inner Ring
| Durham | Halton | Peel | Toronto | York | Hamilton |
Immigration | ||||||
2001-2011 | 1,530 | 1,957 | 17,060 | 57,843 | 8,175 | 3,210 |
2011-2021 | 1,478 | 1,861 | 17,189 | 56,261 | 8,606 | 3,051 |
2021-2031 | 1,446 | 1,792 | 17,559 | 55,494 | 9,151 | 2,936 |
Total | 44,545 | 56,099 | 518,079 | 1,695,978 | 259,319 | 91,967 |
Emigration | ||||||
2001-2011 | -922 | -1,223 | -2,350 | -5,933 | -2,102 | -761 |
2011-2021 | -1,090 | -1,395 | -2,956 | -5,787 | -2,715 | -786 |
2021-2031 | -1,250 | -1,540 | -3,540 | -5,396 | -3,228 | -796 |
Total | -32,614 | -41,584 | -88,455 | -171,154 | -80,447 | -23,434 |
Net Immigration | ||||||
2001-2011 | 608 | 734 | 14,710 | 51,910 | 6,074 | 2,449 |
2011-2021 | 388 | 466 | 14,234 | 50,474 | 5,890 | 2,264 |
2021-2031 | 197 | 252 | 14,019 | 50,098 | 5,923 | 2,140 |
Total | 11,931 | 14,515 | 429,625 | 1,524,824 | 178,872 | 68,533 |
Net Interprovincial | ||||||
2001-2011 | -349 | 109 | 237 | -672 | 38 | -148 |
2011-2021 | -706 | -183 | -469 | -2,369 | -223 | -338 |
2021-2031 | -1,079 | -496 | -1,224 | -4,162 | -502 | -538 |
Total | -21,338 | -5,703 | -14,556 | -72,034 | -6,868 | -10,242 |
Net Intraprovincial | ||||||
2001-2011 | 8,126 | 4,369 | 7,493 | -62,953 | 16,822 | -724 |
2011-2021 | 9,077 | 4,647 | 8,776 | -67,308 | 14,744 | -735 |
2021-2031 | 9,950 | 4,846 | 10,055 | -70,568 | 11,836 | -726 |
Total | 271,528 | 138,619 | 263,245 | -2,008,290 | 434,024 | -21,844 |
Total Net Migration | ||||||
2001-2011 | 8,385 | 5,211 | 22,440 | -11,715 | 22,934 | 1,577 |
2011-2021 | 8,759 | 4,930 | 22,541 | -19,203 | 20,411 | 1,192 |
2021-2031 | 9,068 | 4,602 | 22,850 | -24,632 | 17,258 | 876 |
Total | 262,121 | 147,432 | 678,314 | -555,500 | 606,028 | 36,448 |
Source: Will Dunning Inc.
Table A-1-2: Projections of Migration by Census Division in the Outer Ring
| Brant | Dufferin | Haldimand-Norfolk | Niagara | Northum-berland | Peterborough | Simcoe | Kawartha Lakes | Waterloo | Wellington |
Immigration | ||||||||||
2001-2011 | 323 | 79 | 251 | 1,314 | 111 | 209 | 774 | 57 | 3,395 | 1,007 |
2011-2021 | 305 | 78 | 256 | 1,215 | 110 | 174 | 704 | 57 | 3,305 | 981 |
2021-2031 | 292 | 77 | 264 | 1,134 | 111 | 142 | 645 | 58 | 3,262 | 970 |
Total | 9,207 | 2,340 | 7,704 | 36,623 | 3,310 | 5,263 | 21,236 | 1,711 | 99,618 | 29,584 |
Emigration | ||||||||||
2001-2011 | -143 | -97 | -67 | -693 | -64 | -139 | -570 | -53 | -1,046 | -405 |
2011-2021 | -150 | -113 | -72 | -709 | -70 | -149 | -696 | -60 | -1,280 | -494 |
2021-2031 | -155 | -129 | -74 | -706 | -73 | -155 | -819 | -66 | -1,508 | -567 |
Total | -4,481 | -3,394 | -2,133 | -21,080 | -2,072 | -4,432 | -20,846 | -1,794 | -38,332 | -14,653 |
Net Immigration | ||||||||||
2001-2011 | 180 | -18 | 184 | 621 | 47 | 70 | 205 | 4 | 2,349 | 603 |
2011-2021 | 155 | -36 | 184 | 506 | 40 | 26 | 9 | -4 | 2,025 | 487 |
2021-2031 | 137 | -52 | 189 | 428 | 37 | -13 | -174 | -8 | 1,754 | 403 |
Total | 4,727 | -1,054 | 5,571 | 15,543 | 1,237 | 831 | 391 | -84 | 61,286 | 14,931 |
Net Interprovincial | ||||||||||
2001-2011 | -39 | -53 | -32 | -74 | -33 | -114 | -228 | -85 | 52 | -112 |
2011-2021 | -82 | -74 | -62 | -257 | -71 | -193 | -500 | -131 | -253 | -246 |
2021-2031 | -128 | -94 | -94 | -450 | -111 | -276 | -785 | -178 | -579 | -387 |
Total | -2,483 | -2,209 | -1,879 | -7,808 | -2,147 | -5,834 | -15,135 | -3,950 | -7,797 | -7,453 |
Net Intraprovincial | ||||||||||
2001-2011 | 480 | 900 | 1,013 | 1,523 | 1,062 | 1,312 | 8,853 | 1,455 | 6,713 | 4,500 |
2011-2021 | 509 | 1,023 | 1,139 | 1,598 | 1,115 | 1,466 | 9,923 | 1,578 | 7,741 | 5,234 |
2021-2031 | 529 | 1,140 | 1,256 | 1,641 | 1,146 | 1,608 | 10,915 | 1,679 | 8,411 | 5,614 |
Total | 15,187 | 30,635 | 34,077 | 47,628 | 33,243 | 43,868 | 296,907 | 47,118 | 228,653 | 153,474 |
Total Net Migration | ||||||||||
2001-2011 | 622 | 829 | 1,165 | 2,070 | 1,076 | 1,269 | 8,829 | 1,373 | 9,115 | 4,991 |
2011-2021 | 582 | 914 | 1,260 | 1,847 | 1,084 | 1,299 | 9,432 | 1,443 | 9,513 | 5,475 |
2021-2031 | 539 | 994 | 1,352 | 1,619 | 1,073 | 1,319 | 9,955 | 1,492 | 9,586 | 5,630 |
Total | 17,431 | 27,371 | 37,769 | 55,363 | 32,333 | 38,865 | 282,164 | 43,085 | 282,143 | 160,953 |
Source: Will Dunning Inc.
A. 2 Projections of Population and Population Growth for 16 Census Divisions in the Greater Golden Horseshoe
Table A-2-1: Projections of Population and Population Growth by Census Division in the Inner Ring
| Durham | Halton | Peel | Toronto | York | Hamilton |
Total Population | ||||||
2001-2011 | 526,987 | 390,235 | 1,056,167 | 2,592,460 | 759,320 | 510,073 |
2011-2021 | 632,368 | 453,014 | 1,365,417 | 2,584,667 | 1,029,850 | 533,353 |
2021-2031 | 735,735 | 507,535 | 1,669,774 | 2,455,240 | 1,267,651 | 544,498 |
Total | 827,747 | 549,563 | 1,954,071 | 2,234,967 | 1,449,481 | 543,956 |
Total Population Growth | ||||||
2001-2011 | 105,381 | 62,779 | 309,250 | -7,793 | 270,530 | 23,280 |
2011-2021 | 103,368 | 54,521 | 304,358 | -129,427 | 237,801 | 11,145 |
2021-2031 | 92,012 | 42,027 | 284,297 | -220,272 | 181,830 | -542 |
Total | 300,760 | 159,328 | 897,904 | -357,493 | 690,161 | 33,883 |
Average Annual Population Growth | ||||||
2001-2011 | 10,538 | 6,278 | 30,925 | -779 | 27,053 | 2,328 |
2011-2021 | 10,337 | 5,452 | 30,436 | -12,943 | 23,780 | 1,114 |
2021-2031 | 9,201 | 4,203 | 28,430 | -22,027 | 18,183 | -54 |
Total | 10,025 | 5,311 | 29,930 | -11,916 | 23,005 | 1,129 |
Average Annual % Growth | ||||||
2001-2011 | 1.84% | 1.50% | 2.60% | -0.03% | 3.09% | 0.45% |
2011-2021 | 1.53% | 1.14% | 2.03% | -0.51% | 2.10% | 0.21% |
2021-2031 | 1.19% | 0.80% | 1.58% | -0.94% | 1.35% | -0.01% |
Total | 1.52% | 1.15% | 2.07% | -0.49% | 2.18% | 0.21% |
Source: Will Dunning Inc.
Table A-2-2: Projections of Population and Population Growth by Census Division in the Outer Ring
| Brant | Dufferin | Haldimand-Norfolk | Niagara | Northum-berland | Peterborough | Simcoe | Kawartha Lakes | Waterloo | Wellington |
Total Population | ||||||||||
2001-2011 | 128,871 | 53,022 | 109,504 | 426,532 | 80,022 | 130,678 | 391,819 | 71,818 | 456,349 | 194,821 |
2011-2021 | 136,542 | 62,864 | 119,314 | 441,961 | 89,522 | 140,738 | 487,592 | 82,832 | 568,727 | 246,189 |
2021-2031 | 142,618 | 72,619 | 125,253 | 445,427 | 96,171 | 148,851 | 584,116 | 92,032 | 682,535 | 290,689 |
Total | 145,135 | 81,582 | 127,730 | 435,675 | 97,728 | 153,205 | 673,290 | 97,278 | 787,059 | 322,449 |
Total Population Growth | ||||||||||
2001-2011 | 7,671 | 9,842 | 9,810 | 15,429 | 9,500 | 10,060 | 95,773 | 11,014 | 112,378 | 51,368 |
2011-2021 | 6,076 | 9,755 | 5,939 | 3,465 | 6,649 | 8,113 | 96,524 | 9,200 | 113,808 | 44,500 |
2021-2031 | 2,517 | 8,963 | 2,477 | -9,752 | 1,557 | 4,354 | 89,173 | 5,246 | 104,524 | 31,760 |
Total | 16,264 | 28,560 | 18,226 | 9,143 | 17,706 | 22,527 | 281,471 | 25,460 | 330,710 | 127,628 |
Average Annual Population Growth | ||||||||||
2001-2011 | 767 | 984 | 981 | 1,543 | 950 | 1,006 | 9,577 | 1,101 | 11,238 | 5,137 |
2011-2021 | 608 | 975 | 594 | 347 | 665 | 811 | 9,652 | 920 | 11,381 | 4,450 |
2021-2031 | 252 | 896 | 248 | -975 | 156 | 435 | 8,917 | 525 | 10,452 | 3,176 |
Total | 542 | 952 | 608 | 305 | 590 | 751 | 9,382 | 849 | 11,024 | 4,254 |
Average Annual % Growth | ||||||||||
2001-2011 | 0.58% | 1.72% | 0.86% | 0.36% | 1.13% | 0.74% | 2.21% | 1.44% | 2.23% | 2.37% |
2011-2021 | 0.44% | 1.45% | 0.49% | 0.08% | 0.72% | 0.56% | 1.82% | 1.06% | 1.84% | 1.68% |
2021-2031 | 0.18% | 1.17% | 0.20% | -0.22% | 0.16% | 0.29% | 1.43% | 0.56% | 1.44% | 1.04% |
Total | 0.40% | 1.45% | 0.51% | 0.07% | 0.67% | 0.53% | 1.82% | 1.02% | 1.83% | 1.69% |
Source: Will Dunning Inc.
A.3 Projections of Households and Household Growth for 16 Census Divisions in the Greater Golden Horseshoe
Table A-3-1: Projections of Households and Household Growth by Census Division in the Inner Ring
| Durham | Halton | Peel | Toronto | York | Hamilton |
Total Households | ||||||
2001-2011 | 178,034 | 138,319 | 324,919 | 979,173 | 231,374 | 194,892 |
2011-2021 | 229,848 | 170,098 | 447,974 | 1,006,486 | 337,828 | 213,979 |
2021-2031 | 282,014 | 199,309 | 569,717 | 981,253 | 435,348 | 227,772 |
Total | 325,172 | 221,227 | 680,068 | 912,317 | 510,304 | 233,561 |
Total Household Growth | ||||||
2001-2011 | 51,814 | 31,779 | 123,055 | 27,312 | 106,454 | 19,088 |
2011-2021 | 52,166 | 29,211 | 121,743 | -25,233 | 97,520 | 13,793 |
2021-2031 | 43,159 | 21,918 | 110,351 | -68,936 | 74,956 | 5,788 |
Total | 147,139 | 82,908 | 355,149 | -66,857 | 278,930 | 38,669 |
Average Annual Household Growth | ||||||
2001-2011 | 5,181 | 3,178 | 12,306 | 2,731 | 10,645 | 1,909 |
2011-2021 | 5,217 | 2,921 | 12,174 | -2,523 | 9,752 | 1,379 |
2021-2031 | 4,316 | 2,192 | 11,035 | -6,894 | 7,496 | 579 |
Total | 4,905 | 2,764 | 11,838 | -2,229 | 9,298 | 1,289 |
Average Number of People Per Household | ||||||
2001-2011 | 2.96 | 2.82 | 3.25 | 2.65 | 3.28 | 2.62 |
2011-2021 | 2.75 | 2.66 | 3.05 | 2.57 | 3.05 | 2.49 |
2021-2031 | 2.61 | 2.55 | 2.93 | 2.50 | 2.91 | 2.39 |
Total | 2.55 | 2.48 | 2.87 | 2.45 | 2.84 | 2.33 |
Source: Will Dunning Inc.
Table A-3-2: Projections of Households and Household Growth by Census Division in the Outer Ring
| Brant | Dufferin | Haldimand-Norfolk | Niagara | Northumberland | Peterborough | Simcoe | Kawartha Lakes | Waterloo | Wellington |
Total Households | ||||||||||
2001-2011 | 48,257 | 17,820 | 40,046 | 167,781 | 30,140 | 51,300 | 142,002 | 27,626 | 167,319 | 70,806 |
2011-2021 | 54,219 | 22,789 | 47,308 | 183,620 | 37,137 | 58,240 | 188,458 | 35,287 | 221,775 | 102,283 |
2021-2031 | 59,184 | 27,932 | 52,952 | 194,149 | 42,529 | 63,966 | 236,670 | 42,580 | 277,850 | 130,830 |
Total | 61,730 | 32,108 | 56,171 | 195,644 | 44,785 | 67,249 | 278,716 | 47,313 | 329,352 | 152,005 |
Total Household Growth | ||||||||||
2001-2011 | 5,963 | 4,969 | 7,262 | 15,839 | 6,998 | 6,940 | 46,455 | 7,660 | 54,456 | 31,477 |
2011-2021 | 4,965 | 5,143 | 5,644 | 10,529 | 5,392 | 5,726 | 48,212 | 7,293 | 56,075 | 28,547 |
2021-2031 | 2,546 | 4,175 | 3,219 | 1,494 | 2,256 | 3,283 | 42,046 | 4,733 | 51,502 | 21,175 |
Total | 13,473 | 14,288 | 16,125 | 27,863 | 14,645 | 15,949 | 136,714 | 19,687 | 162,033 | 81,199 |
Average Annual Household Growth | ||||||||||
2001-2011 | 596 | 497 | 726 | 1,584 | 700 | 694 | 4,646 | 766 | 5,446 | 3,148 |
2011-2021 | 497 | 514 | 564 | 1,053 | 539 | 573 | 4,821 | 729 | 5,607 | 2,855 |
2021-2031 | 255 | 418 | 322 | 149 | 226 | 328 | 4,205 | 473 | 5,150 | 2,118 |
Total | 449 | 476 | 538 | 929 | 488 | 532 | 4,557 | 656 | 5,401 | 2,707 |
Average Number of People Per Household | ||||||||||
2001-2011 | 2.67 | 2.98 | 2.73 | 2.54 | 2.66 | 2.55 | 2.76 | 2.60 | 2.73 | 2.75 |
2011-2021 | 2.52 | 2.76 | 2.52 | 2.41 | 2.41 | 2.42 | 2.59 | 2.35 | 2.56 | 2.41 |
2021-2031 | 2.41 | 2.60 | 2.37 | 2.29 | 2.26 | 2.33 | 2.47 | 2.16 | 2.46 | 2.22 |
Total | 2.35 | 2.54 | 2.27 | 2.23 | 2.18 | 2.28 | 2.42 | 2.06 | 2.39 | 2.12 |
Source: Will Dunning Inc.
A.4 Projections of Employment and Employment Growth for 16 Census Divisions in the Greater Golden Horseshoe
Table A-4-1: Projections of Employment and Employment Growth by Census Division in the Inner Ring
| Durham | Halton | Peel | Toronto | York | Hamilton |
Total Employment | ||||||
2001-2011 | 278,120 | 215,532 | 577,771 | 1,299,771 | 408,031 | 245,670 |
2011-2021 | 343,679 | 254,723 | 749,838 | 1,295,871 | 562,642 | 261,305 |
2021-2031 | 384,436 | 277,033 | 894,066 | 1,190,845 | 670,331 | 257,721 |
Total | 410,465 | 285,451 | 1,010,967 | 1,037,081 | 734,241 | 241,575 |
Total Employment Growth | ||||||
2001-2011 | 65,560 | 39,191 | 172,067 | -3,900 | 154,611 | 15,635 |
2011-2021 | 40,757 | 22,310 | 144,227 | -105,027 | 107,689 | -3,584 |
2021-2031 | 26,029 | 8,418 | 116,902 | -153,764 | 63,910 | -16,146 |
Total | 132,346 | 69,919 | 433,196 | -262,691 | 326,210 | -4,095 |
Average Annual Employment Growth | ||||||
2001-2011 | 6,556 | 3,919 | 17,207 | -390 | 15,461 | 1,563 |
2011-2021 | 4,076 | 2,231 | 14,423 | -10,503 | 10,769 | -358 |
2021-2031 | 2,603 | 842 | 11,690 | -15,376 | 6,391 | -1,615 |
Total | 4,412 | 2,331 | 14,440 | -8,756 | 10,874 | -137 |
Average Annual % Growth | ||||||
2001-2011 | 2.1% | 1.7% | 2.6% | 0.0% | 3.3% | 0.6% |
2011-2021 | 1.1% | 0.8% | 1.8% | -0.8% | 1.8% | -0.1% |
2021-2031 | 0.7% | 0.3% | 1.2% | -1.4% | 0.9% | -0.6% |
Total | 1.3% | 0.9% | 1.9% | -0.7% | 2.0% | -0.1% |
Employment Rate | ||||||
2001 | 68.1% | 69.3% | 70.3% | 60.7% | 68.1% | 59.5% |
2011 | 65.8% | 67.5% | 67.8% | 60.2% | 66.3% | 58.2% |
2021 | 62.6% | 64.7% | 65.2% | 57.5% | 63.3% | 55.4% |
2031 | 59.2% | 61.5% | 62.6% | 54.5% | 60.1% | 51.9% |
Source: Will Dunning Inc.
Table A-4-2: Projections of Employment and Employment Growth by Census Division in the Outer Ring
| Brant | Dufferin | Haldimand-Norfolk | Niagara | Northum-berland | Peter- | Simcoe | Kawartha Lakes | Waterloo | Wellington |
Total Employment | ||||||||||
2001-2011 | 64,592 | 28,645 | 55,442 | 209,669 | 38,548 | 61,076 | 199,247 | 32,932 | 245,680 | 106,124 |
2011-2021 | 70,122 | 35,128 | 58,833 | 217,505 | 42,320 | 66,260 | 252,817 | 38,543 | 320,118 | 136,926 |
2021-2031 | 70,273 | 39,586 | 57,014 | 207,110 | 40,750 | 65,877 | 290,854 | 39,168 | 380,146 | 156,004 |
Total | 68,567 | 42,210 | 51,879 | 188,511 | 38,168 | 64,527 | 318,820 | 37,259 | 424,245 | 155,662 |
Total Employment Growth | ||||||||||
2001-2011 | 5,531 | 6,483 | 3,391 | 7,836 | 3,772 | 5,183 | 53,570 | 5,611 | 74,437 | 30,802 |
2011-2021 | 150 | 4,458 | -1,819 | -10,395 | -1,570 | -383 | 38,037 | 625 | 60,028 | 19,078 |
2021-2031 | -1,705 | 2,624 | -5,136 | -18,599 | -2,582 | -1,351 | 27,966 | -1,910 | 44,099 | -342 |
Total | 3,975 | 13,565 | -3,564 | -21,158 | -380 | 3,450 | 119,573 | 4,326 | 178,564 | 49,538 |
Average Annual Employment Growth | ||||||||||
2001-2011 | 553 | 648 | 339 | 784 | 377 | 518 | 5,357 | 561 | 7,444 | 3,080 |
2011-2021 | 15 | 446 | -182 | -1,040 | -157 | -38 | 3,804 | 63 | 6,003 | 1,908 |
2021-2031 | -171 | 262 | -514 | -1,860 | -258 | -135 | 2,797 | -191 | 4,410 | -34 |
Total | 133 | 452 | -119 | -705 | -13 | 115 | 3,986 | 144 | 5,952 | 1,651 |
Average Annual % Growth | ||||||||||
2001-2011 | 0.8 | 2.1 | 0.6 | 0.4 | 0.9 | 0.8 | 2.4 | 1.6 | 2.7 | 2.6 |
2011-2021 | 0.0 | 1.2 | -0.3 | -0.5 | -0.4 | -0.1 | 1.4 | 0.2 | 1.7 | 1.3 |
2021-2031 | -0.2 | 0.6 | -0.9 | -0.9 | -0.7 | -0.2 | 0.9 | -0.5 | 1.1 | 0.0 |
Total | 0.2 | 1.3 | -0.2 | -0.4 | 0.0 | 0.2 | 1.6 | 0.4 | 1.8 | 1.3 |
Employment Rate (%) | ||||||||||
2001 | 63.0 | 70.7 | 63.2 | 60.0 | 59.2 | 56.8 | 64.4 | 56.2 | 67.7 | 68.5 |
2011 | 61.6 | 68.1 | 59.4 | 57.8 | 54.6 | 55.1 | 62.0 | 53.1 | 67.7 | 64.7 |
2021 | 58.6 | 65.1 | 53.1 | 53.8 | 48.4 | 51.6 | 58.9 | 47.2 | 66.2 | 60.3 |
2031 | 55.9 | 61.9 | 47.4 | 49.8 | 44.1 | 48.7 | 55.9 | 42.0 | 63.4 | 53.5 |
Source: Will Dunning Inc.
A.5 Economic Influences on Household Formation Rates and Household Sizes
This section analyzes household formation rates to determine the extent to which changes in economic variables affect household formation rates.
In economic analysis, the usual approach is a "time series analysis" -- examining data over many years to find the relationship between economic change over time and changes in household formation rates. However, since data on household formation rates are available only at five-year intervals, there is not enough data to conduct a meaningful time series analysis.
As an alternative, an analysis was conducted at two specific points (the 1996 census and the 2001 census), to see how economic variations from location to location relate to variations in household formation rates. An attempt was made to draw inferences about how economic variations affect headship rates over time. However, this analysis of household formation rates does not lead to strong conclusions for future household formation.
Although a subsequent analysis of household sizes led to stronger conclusions about how economic change affects household sizes, those results are not strong enough to predict future household sizes.
Method
The analysis was conducted using data from the 1996 and 2001 censuses.
- Analysis was conducted for the 25 Census Metropolitan Areas (CMAs) available in both the 1996 and 2001 census.
- Census data provide the number of households by the age of the "primary household maintainer." The data are aggregated into age groups in 10-year increments. In the 2001 census data, the age groups for household maintainers are 15-24, 25-34, 35-44, 45-54, 55-65, 65-74, and 75 and over. In the 1996 data, the oldest age category is 65 years and over. To permit comparison between the 1996 and 2001 data, in the 2001 census data, the two oldest categories (65-74 and 75 and over) were combined into a 65-and-over -grouping.
- Data were obtained on population for each corresponding age group.
- The number of households in each age group, divided by the population in each age group, provides the household formation rate by age group for each of the 25 CMAs. These household formation rates are also referred to as "headship rates."
The census variables that were selected for analysis (for each CMA) were:
- Homeowner's average monthly major payment: expected to have a negative impact -- higher costs should result in lower household formation rates.
- Average monthly gross rent payment: expected impact is negative -- higher costs should result in lower household formation rates.
- Employment-to-population ratio for persons aged 15 years and older: expected impact is positive -- a higher employment rate should result in higher household formation rates.
- Average annual income for persons aged 15 years and older: expected impact is positive -- higher income should result in higher household formation rates.
- Average value of owner-occupied dwellings: expected impact is negative -- higher costs should result in lower household formation rates.
- Percentage of the population aged five and over that immigrated from another country within the past five years: possible negative impact on household formation rates, if recent immigrants live in larger household groupings for cultural or economic reasons. However, the impacts of recent immigration may be partially found in other economic variables, such as the income variable or the employment-to-population ratio. Thus, an impact from this variable should not necessarily be expected.
Combinations of these variables were tested (using multiple regression analysis) to determine the extent to which the variables can explain headship rates across the 25 CMAs. Each of the age groups was tested separately, using data for 2001.
Findings for Household Formation Rates
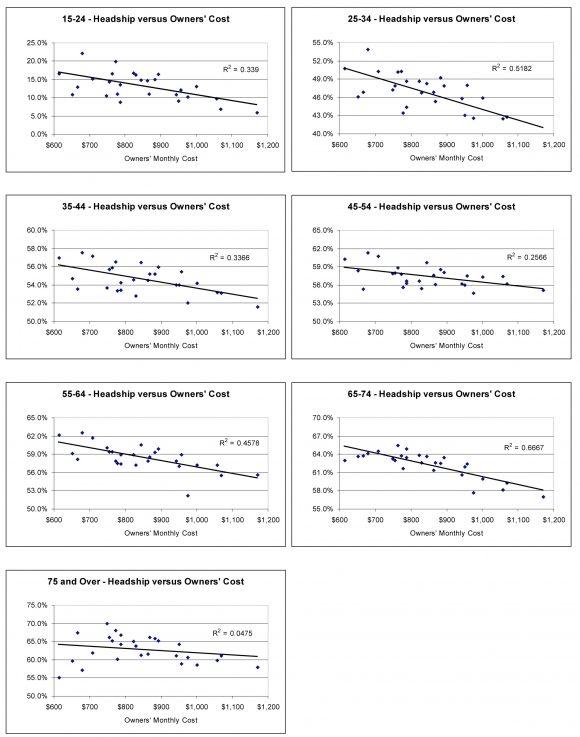
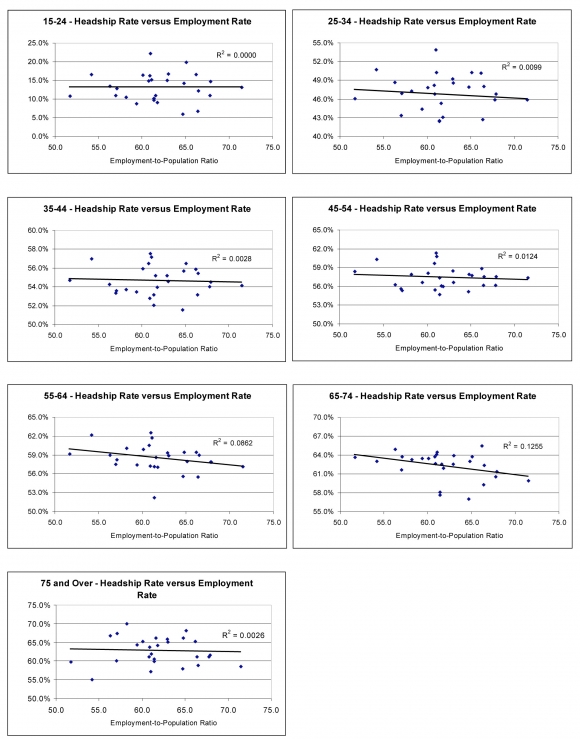
The review of the data found some relationships between headship rates and economic indicators. The scatter plot charts in Appendix A.6 show the headship rates in relation to some economic variables. The charts strongly suggest a relationship between housing costs and household formation rates. The relationship between household formation rates and the employment-to-population ratio is less obvious; however, when the employment ratio is tested statistically in combination with housing cost variables, it appears that housing costs and the employment ratio act in combination to influence household formation rates.
The model that provides the most robust results overall (using the 2001 data) analyzes headship rates as a function of average homeowners' monthly costs and the employment-to-population ratio. The inclusion of other variables resulted in less strong results.*
Not only did this specification provide the strongest results, but the estimated effects also had the expected directions:
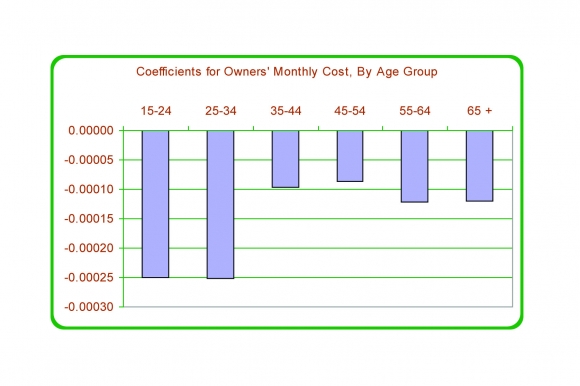
- Owners' cost has the expected negative effect -- higher costs result in lower headship rates for all age groups.
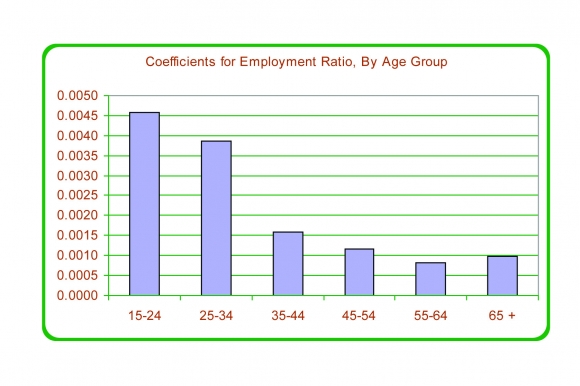
- The employment-to-population ratio has the expected positive effect -- higher ratios result in higher headship rate for all age groups.
In addition, the estimated impacts for the two variables are strongest for the youngest age groups, weakest for the age groups in the middle, and slightly stronger for the older age groups. This pattern makes sense. Figures 29 and 30 show the estimated factors ("coefficients") for the effect of the two economic variables on headship rates, by age group.
Figure 29: Coefficients for Owners' Monthly Costs, by Age Group
Figure 30: Coefficients for Employment Ratio, by Age Group
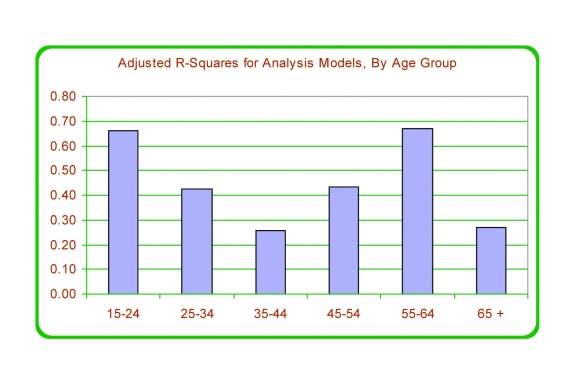
The analysis indicates the reliability of the estimates. In Figure 31, the "Adjusted R-Square" statistics are shown for each of the age groups. If the model did a perfect job of explaining variations in headship rates, the Adjusted R-Square would be equal to 1.00. Figure 31 shows that the reliability statistics range from 0.26 to 0.67. The higher figures indicate a higher level of reliability, while the lower figures indicate results that are probably unreliable.
Figure 31: Adjusted R-Squares for Analysis Models, by Age Group
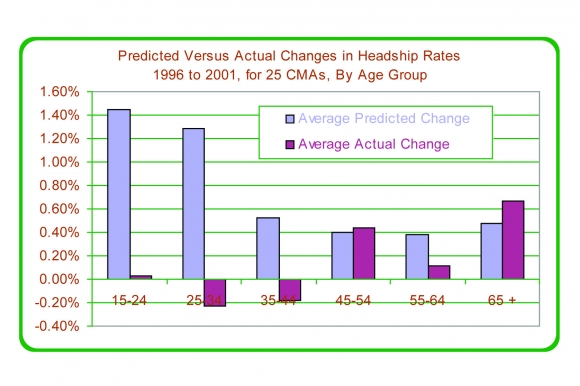
The next step was to use these analysis results to simulate how the headship rates "should" have changed during 1996 to 2001, given the changes that occurred in the economic variables. In other words, for each of the 25 CMAs, for each of the age groups, the predicted changes in headship rates were compared to the changes that actually occurred. Figure 32 shows that:
- For the three younger age groups, the economic analysis predicts relatively large increases in the headship rates, because homeowners' costs fell during the period (in inflation-adjusted dollars) and the employment-to-population ratios increased in most of the CMAs (due to economic expansion in most areas of the country). In actuality, however, headship rates for the younger age groups changed very little or fell. Therefore, the predictions generated for the younger age groups were far off the mark.
- For the three older age groups, the predictions were more accurate, as increases were predicted and increases actually occurred.
Figure 32: Predicted vs. Actual Changes in Headship Rates, for 25 CMAs, by Age Group, 1996 to 2001
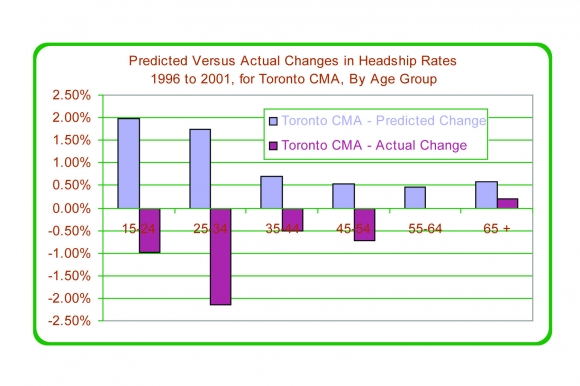
The results for the Toronto CMA are of particular interest. Figure 33 compares the predicted increases in headship rates with the actual increases, and shows that the Toronto CMA estimates were completely inaccurate: while increased headship rates are predicted for all age groups, the rates actually fell for five of the six age groups. The magnitudes of the errors were especially large for the two youngest age groups. The reduction in headship rates for the 15-24 and 25-34 age groups is undoubtedly related to the rapid rent increases that occurred after the introduction of the Tenant Protection Act in June 1998. Unfortunately, in the analysis of all 25 CMAs, rents were not found to significantly affect headship rates, as the effects of owners' costs were overwhelming statistically. Thus, it is not possible to test the extent to which rent increases might have reduced headship rates in Toronto.
Figure 33: Predicted vs. Actual Changes in Headship Rates for Toronto CMA, by Age Group, 1996 to 2001
In conclusion, this analysis did not generate results that could be used to confidently predict future headship rates. However, the analysis does support a theory that economic variables do affect household formation rates, and therefore that changes in future economic conditions are likely to influence headship rates. The directions of the influences are:
- A rising cost of homeownership is likely to reduce household formation and a falling cost to increase household formation.
- A rising employment-to-population ratio is likely to increase household formation and a falling ratio to reduce household formation.
If conclusions can be drawn about the likely directions of these economic variables in future, then conclusions could also be drawn about the directions of headship rates.
Analysis of Household Sizes
The analysis of household formation rates (by age group) was inconclusive. Modelling cannot predict changes in household formation rates by age group, especially for the younger groups. However, analysis might generate useful results on a less-detailed basis for each of the CMAs as a whole, rather than for specific age groups. Thus, an additional analysis was conducted to examine for each of the CMAs the average number of adults per household.
The data set used is not the same as the average number of people per household -- this analysis excludes people under the age of 15, in order to concentrate on the people who could potentially head their own households.
This analysis used the same set of explanatory variables as before. The anticipated effects of the variables are the opposites of those expected for the headship rate analysis:
- Homeowner's average monthly major payment: expected to have a positive impact -- higher costs should result in more adults per household.
- Average monthly gross rent payment: expected to have a positive impact -- higher costs should result in more adults per household.
- Employment-to-population ratio for persons aged 15 years and older: expected impact is negative -- a higher employment rate should result in fewer adults per household.
- Average annual income for persons aged 15 years and older: expected impact is negative -- higher incomes should result in fewer adults per household.
- Average value of owner-occupied dwellings: expected to have a positive impact -- higher costs should result in more adults per household.
- Percentage of the population aged five and over that immigrated from another country within the past five years. There may be a positive impact on household sizes, if recent immigrants tend to live in larger household groupings for cultural or economic reasons.
In addition, data on the distribution of the adult population by age was included, since different age groups may have different household sizes.
Various combinations of the data were tested. The model that best explains variations in the number of adults per household uses average owners' costs and the employment-to-population ratio, as well as data on age distributions: the two economic variables that were most influential in this analysis also produced the most reliable results in the headship rate analysis.
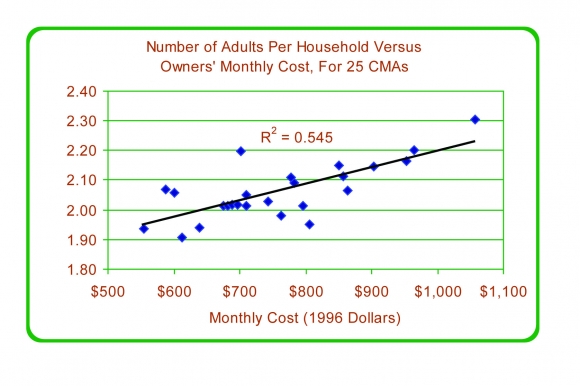
Figures 34 and 35 show the relationships between household sizes and the two key economic variables. In Figure 34, there is a clear relationship between the owners' costs and the number of adults per household, and the relationship is quite strong, as indicated by the clustering of most of the data points close to the trend line and the relatively high R-Square figure of 0.545. Moreover, the relationship has the expected direction -- higher housing costs are associated with larger household size.
Figure 34: Number of Adults per Household vs. Owners' Monthly Costs, for 25 CMAs
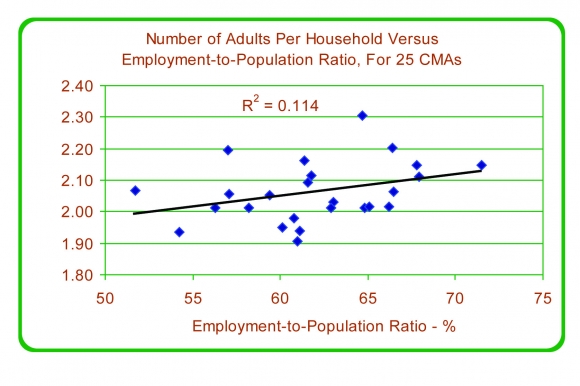
In Figure 35, the relationship between household size and the employment-to-population ratio is weak, as the R-Square is just 0.11, and the direction is the opposite of what was expected -- in this chart a higher employment ratio appears to result in larger household sizes, whereas the opposite is expected.
Figure 35: Number of Adults per Household vs. Employment-to-Population Ratio, for 25 CMAs
However, when the two variables are analyzed in combination, the direction on the employment variable changes to the expected downward slope, and both of the two economic variables are found to be statistically significant in explaining variations in household size across the 25 CMAs.* Also, the two variables have roughly equal force in causing variations of household sizes. This finding indicates that housing costs and employment opportunities have equal impacts on household sizes and therefore on the rate of household formation.
The next step is to assess the extent to which the results from the 2001 data can be used to predict the actual changes that occurred between 1996 and 2001.
Table A-5-1: Adults per Household in 1996 and 2001, for 25 CMAs
Census Metropolitan Area | Adults Per Household | Change from 1996 to 2001 | |||
1996 | 2001 | Actual Change | Predicted Change | Error | |
St. John's | 2.32 | 2.20 | -0.12 | -0.16 | -0.043 |
Halifax | 2.09 | 2.03 | -0.06 | -0.12 | -0.056 |
Saint John | 2.13 | 2.06 | -0.07 | -0.16 | -0.088 |
Chicoutimi-Jonquiere | 2.15 | 2.07 | -0.09 | -0.22 | -0.130 |
Quebec | 2.01 | 1.94 | -0.07 | -0.21 | -0.144 |
Sherbrooke | 1.97 | 1.91 | -0.06 | -0.20 | -0.136 |
Trois-Rivieres | 1.99 | 1.94 | -0.06 | -0.20 | -0.141 |
Montreal | 2.01 | 1.98 | -0.03 | -0.15 | -0.119 |
Ottawa-Hull | 2.08 | 2.06 | -0.02 | -0.16 | -0.139 |
Oshawa | 2.19 | 2.20 | 0.01 | -0.12 | -0.133 |
Toronto | 2.29 | 2.30 | 0.02 | -0.09 | -0.109 |
Hamilton | 2.12 | 2.11 | -0.01 | -0.08 | -0.071 |
St. Catharines-Niagara | 2.08 | 2.05 | -0.03 | -0.12 | -0.093 |
Kitchener | 2.13 | 2.15 | 0.01 | -0.10 | -0.113 |
London | 2.03 | 2.01 | -0.02 | -0.12 | -0.106 |
Windsor | 2.11 | 2.09 | -0.01 | -0.03 | -0.020 |
Greater Sudbury | 2.08 | 2.01 | -0.07 | -0.16 | -0.092 |
Thunder Bay | 2.07 | 2.01 | -0.05 | -0.14 | -0.091 |
Winnipeg | 2.03 | 2.01 | -0.02 | -0.13 | -0.114 |
Regina | 2.02 | 2.02 | 0.00 | -0.11 | -0.110 |
Saskatoon | 2.00 | 2.02 | 0.01 | -0.10 | -0.109 |
Calgary | 2.11 | 2.15 | 0.03 | -0.11 | -0.142 |
Edmonton | 2.10 | 2.11 | 0.01 | -0.12 | -0.130 |
Vancouver | 2.16 | 2.16 | 0.01 | -0.07 | -0.079 |
Victoria | 1.96 | 1.95 | -0.01 | -0.13 | -0.117 |
Average | 2.09 | 2.06 | -0.028 | -0.133 | -0.105 |
Source: Will Dunning Inc., using data from Statistics Canada 1996 and 2001 Census of Canada
Table A.5-1 presents the results from that analysis. In general, the table shows that:
- Household sizes (as measured by the number of adults per household) tended to fall from 1996 to 2001, as the averages fell in 18 of the 25 CMAs. The analysis indicates that the reduction in household size is due to improvements in both the monthly cost of owner-occupied housing (which fell in 17 CMAs) and the improved job market (the employment-to-population ratio increased in 24 CMAs).
- Actual reductions in household sizes tended to be much less than the amounts predicted by the analysis of 2001 census data. On average (using a simple, unweighted average of the 25 CMAs) the expected reduction was -0.133 persons; the actual reduction was -0.028, or just one-fifth of the expected decline.
- In two of the 25 CMAs, the predicted changes were close to the actual changes -- with differences of plus or minus 0.05 or less. In 16 of the CMAs, the differences were large -- plus or minus 0.10 or more.
In the Toronto CMA, the predicted change was a significant reduction (0.109 persons) in the average number of adults per household (implying an increased rate of household formation). But in actuality, there was a marginal increase in household size, despite the favourable economic situation.
Once again, the analysis indicates that household formation (in this case measured as the number of adults per household) is affected by housing costs and employment opportunities, and the influences of these two economic variables are in the expected direction. However, once again, the economic variables do not do a good job of explaining changes that occurred between 1996 and 2001.
Among the possible explanations is that this approach assumes that adjustments of household formation rates will occur instantaneously when economic conditions change. However, responses to economic change are likely to be gradual, considering the range of personal choices (relationships within families, especially) that are involved. Since the changes in the economic variables were quite large during the five-year period, it is possible that while the process of adjusting household sizes began, it was far from complete by the time of the 2001 census, and that further adjustment would continue over the following years.
This idea can be explored further by applying the analysis to the five Census Divisions of the Greater Toronto Area, to estimate the amount of adjustment that occurred during 1996 to 2001 as well as after the 2001 census, and to compare the actual changes to what is predicted by the analysis.
The analysis suggests the following:
- Based on the actual populations in 2001, and based on the predicted household sizes in 2001, there should have been 1,869,010 households in this combined area. The actual number of households (based on the same population figures) was 1,780,495.
- Therefore, there is a large estimated shortfall of about 88,500 households as of 2001. If household formation had been affected to the extent predicted by the model, housing demand in the GTA would have been almost 90,000 units higher than actually occurred during the 1996 to 2001 period, or about 18,000 units per year higher. This leaves a large backlog of potential housing demand that could come into effect after the 2001 census. This backlog of demand would be in addition to newly created demand each year. The consequence would be a high level of housing activity for many years to come.
Table 6.5-2: Estimation of Potential Surplus or Shortfall in Households as of 2001 Due to Incomplete Adjustment to Changed Economic Conditions in Census Divisions of the GTA
CD | Adults Per Household in 2001 | Number
| Number of Households in 2001 | Implied | Surplus (Shortfall) in Households | |
Actual | Predicted | |||||
Durham | 2.279 | 2.120 | 391,335 | 171,725 | 184,635 | -12,910 |
York | 2.570 | 2.461 | 573,540 | 223,185 | 233,019 | -9,834 |
Toronto | 2.171 | 2.092 | 2,047,660 | 943,075 | 978,793 | -35,718 |
Peel | 2.499 | 2.362 | 771,655 | 308,845 | 326,688 | -17,843 |
Halton | 2.231 | 2.199 | 298,220 | 133,665 | 135,612 | -1,947 |
GTA | 2.293 | 2.184 | 4,082,410 | 1,780,495 | 1,869,010 | -88,515 |
Source: Will Dunning Inc., using data from Statistics Canada 1996 and 2001 Census of Canada
Table 6.5-2 shows the analysis of that shortfall.
Three and a half years have passed since the 2001 census, and if the "expected" adjustment is occurring, it may be possible to find evidence of the adjustment, by estimating the extent to which household sizes in the GTA have changed in the interval.
Much has changed since the 2001 census. As of December 2004:
- Housing completions have added an estimated 162,576 new dwellings.
- Vacancies have increased. Using CMHC data on vacancies in the conventional apartment stock and adding an estimate of vacancy change in the rental stock not covered by CMHC's survey, the number of vacant units is estimated to have increased by 18,229 units.
- Subtracting the change in vacancies from the number of completed units, the number of occupied dwelling units (households) is estimated to have increased by 144,347, or about 40,300 units per year.
- The adult population of the GTA has expanded, according to Statistics Canada's Labour Force, by 368,500. This would result in a total adult population of 4,450,910 as of December 2004.
- Thus, as of December 2004, it is estimated that the average number of adults per household in the GTA is 2.312. This is an increase of 0.020 adults per household from the 2001 census figure.
Thus, while we were looking for evidence that household size in the GTA is falling, this analysis suggests that it has actually continued to increase.
In terms of the economic variables:
- The monthly cost of homeownership has increased. According to the Consumer Price Index, the cost of owned accommodation in the Toronto CMA increased by 10.5 percent during May 2001 to December 2004. The overall inflation rate was 6.7 percent. Therefore, the cost of homeownership increased by 3.5 percent in inflation-adjusted terms. This should tend to increase household sizes.
- The employment-to-population ratio has fallen. In both the Toronto CMA and the GTA, the seasonally adjusted employment rate fell by about 0.9 from May 2001 to December 2004. This should also increase household size.
Combining these economic effects with anticipated shifts in the age structure of the population, the average number of adults per household in the GTA should have increased by a small amount -- 0.007 adults per household -- and the average number of adults per household should be about 2.299. The actual increase was larger than predicted (0.020 people, almost triple the predicted amount) and the average household size is larger than predicted, at an estimate of 2.312 versus the predicted 2.299.
Conclusions
This section explored the relationship between two measures of household formation (age-specific headship rates and the average number of adults per household) and economic conditions.
The analysis indicates that housing costs (as measured by the monthly cost of homeownership) and employment opportunities (measured by the employment-to-population ratio) affect the rate of household formation. Demographic change (change in the age distribution of the population) is also important. However, the analysis explains only part of the actual change in household formation.
From 1996 to 2001, economic conditions were favourable -- the labour market strongly improved and homeownership costs fell (after adjustment for inflation). This should have resulted in higher rates of household formation and smaller household sizes. However, improvements in household formation were much less than expected, both on a national basis and for the GTA (where household formation rates fell and household size increased).
Since the 2001 Census, economic conditions in the GTA have deteriorated -- the employment-to-population ratio has fallen and the real cost of homeownership has increased. The analysis predicts that this should result in reduced household formation and an increase in the number of adults per household. It appears that the expected increase in household size has occurred, but that the increase is larger than expected.
Thus, despite an earlier supposition that the process of adjustment was ongoing, and that household formation rates might continue to increase, it appears that housing demand has encountered a turning point, and that household formation rates are more likely to weaken than to strengthen, at least in the mid-term.
Simulations derived from the analysis models do not do a good job of explaining the actual changes that occurred from 1996 to 2001. This result is not entirely surprising, as household formation rates have defied demographic and economic predictions for the past three decades.
While this analysis cannot exactly predict the amount of change in household size, it does provide a basis for understanding the relationship between household size and economic conditions, and therefore provides an indication of the direction of change:
- If housing costs rise in real terms from 2001 to 2031 (as they could), household formation rates are likely to fall.
- Increasing employment opportunities increase household formation rates. If employment opportunities remain at the same level as they were over the past business cycle, household formation rates are unlikely to increase.
In conclusion, from 2001 to 2031, household formation rates are not likely to rise from 2001 levels. In the body of the report, projections of household formation assume that, over the projection period, household formation rates (by age group) will be at the 2001 rates.

