This section of the report examines the spatial evolution of retail commercial development across the Greater Toronto Area between 1996 and 2005. The analysis draws on methods from the branch of geographical statistics concerned with the analysis of patterns of events (e.g., disease, crime, development). Geographical statistics are applied here to study commercial development processes that have led to the development, over time, of retail destinations distributed across the GTA.
The data for this analysis were taken from the CSCA databases, which contain retail location data for the GTA organized by opening year. This provided us with 10 sets of retail location distributions (one set of retail location distributions for each year between 1996 and 2005) for each of the following retail formats:
- community and neighbourhood shopping;
- enclosed regional and super-regional malls;
- retail power centres.
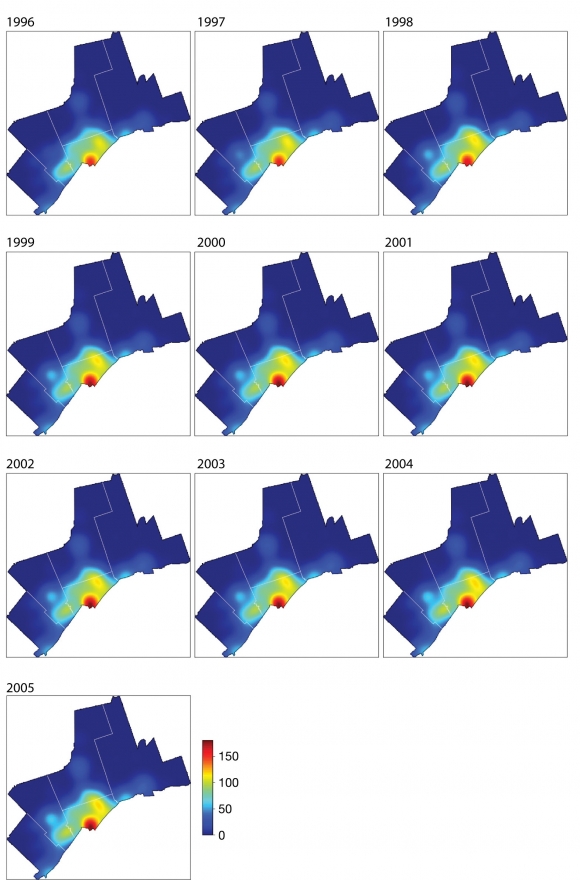
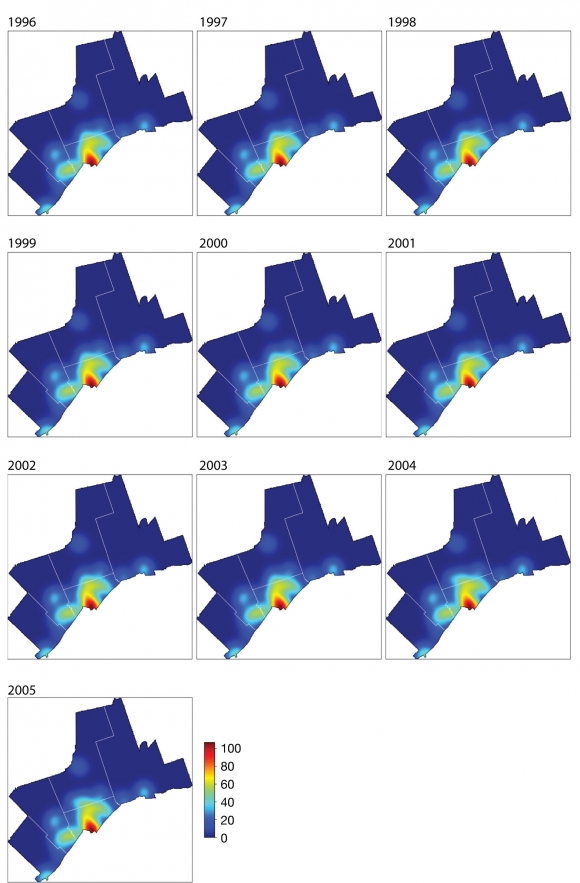
This created a total of 30 maps, showing the distribution of each format by opening year, for each of the 10 years (Figures 7 through 9).
The method used to create the maps, which involved the local smoothing of retail square footage surveyed at each retail location for a particular year, is described in detail in the Appendix. The process produced a time series of retail maps showing regional trends in the intensity of retail development. Areas characterized by a greater intensity of retail development are shown in red and yellow. The maps illustrate the spatially uneven growth and geographical clustering of retail capacity (measured in retail square feet) across the GTA.
The initial evidence suggests that retail activities develop in a non-uniform manner across space. While this finding is expected, given constraints such as zoning and changes in market forces, the maps indicate the regional subareas that host larger shares of specific types of retail.
In Figures 7 and 8, we see that community and neighbourhood shopping (usually in the form of small unenclosed malls and plazas with parking in front) and the enclosed regional and super-regional malls tend to cluster in the historic urban centre of the Greater Toronto Area, with the intensity of this sort of development tapering off toward the limits of the inner suburbs (e.g., the edge of the City of Toronto boundary). By comparison, Figure 9 shows that power centres are a suburban phenomenon. Moreover, the maps indicate that the development of the various retail formats has ebbed and flowed over the 10-year period. For example, while power centre development accelerated during the 10-year period, very little change occurred in shopping centre development.
Figure 7: Community and neighbourhood shopping (units are '00s of retail sq. ft.)
The pattern of community and neighbourhood shopping reflects the commercial legacy of the 1960s to the 1980s. In addition, over the 10-year period, there is evidence of increasing retail development in downtown Toronto and to the east and west of downtown, reflecting both infill and the growing consumer markets within the inner suburbs (Scarborough, Etobicoke, East York), and outer suburbs (Mississauga). The maps also reflect developing food- and pharmacy-anchored centres in the new subdivision growth areas of the GTA.
The intensity of community and neighbourhood retailing in the core is an interesting phenomenon. The patterns reflect the constraints of local planning and zoning regulations and suggest that the reproduction and outward expansion of retail formats suited to the mix of traditional and high-density neighbourhoods served by a dense transit network within the historic core is limited.
The 15-year hiatus in the development of enclosed malls is apparent in Figure 8, which shows that little change has occurred in the intensity of enclosed mall development across the 10-year period. The only major mall developed in Canada since 1989 has been Vaughan Mills to the northwest of Toronto, less than 5 kilometres away from the largest power node in the GTA. These two locations, along with some ancillary retail opportunities, offer more than 5 million square feet of retail space. Between 1989 and 2004, however, the CSCA databases indicate that about 90 million sq. ft. of power retail development was built across Canada.


