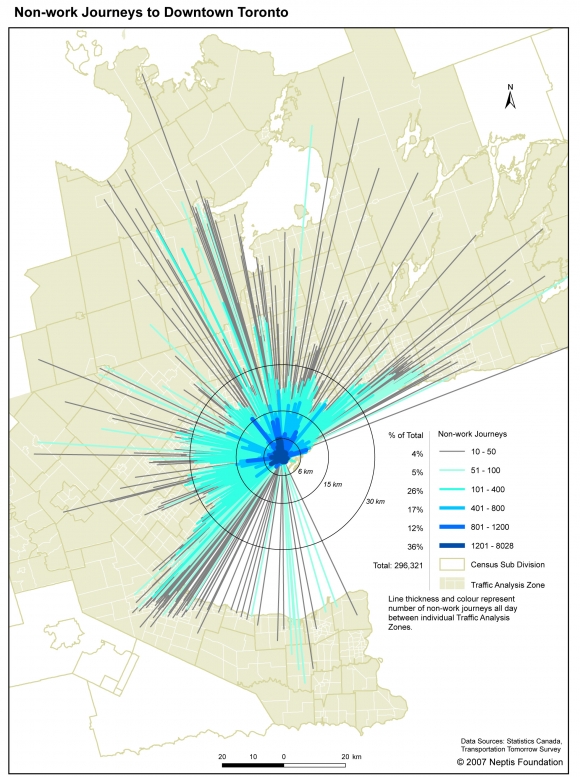
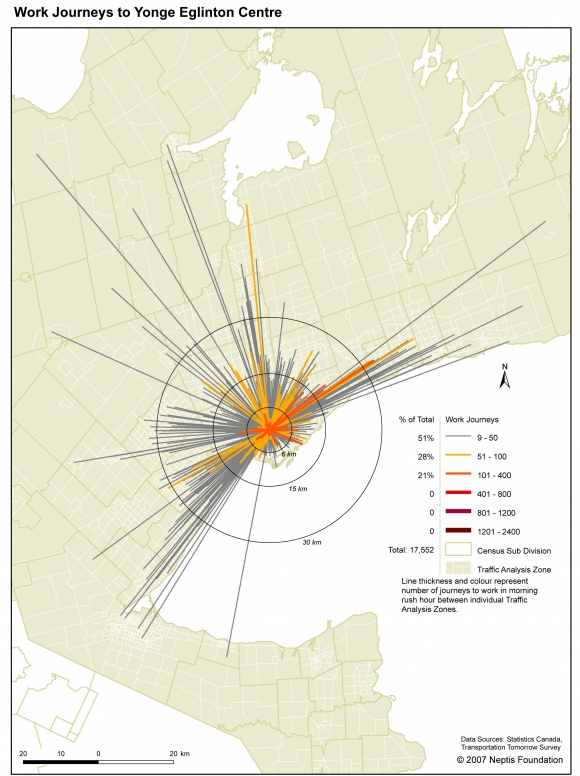
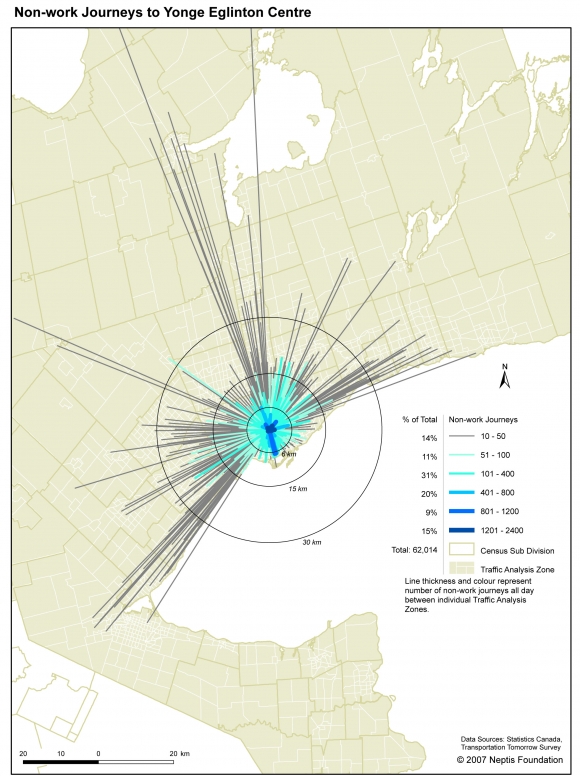
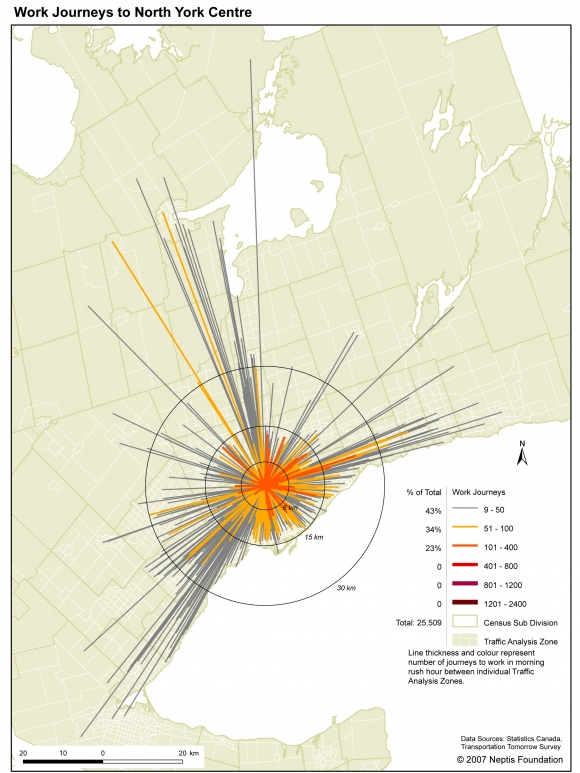
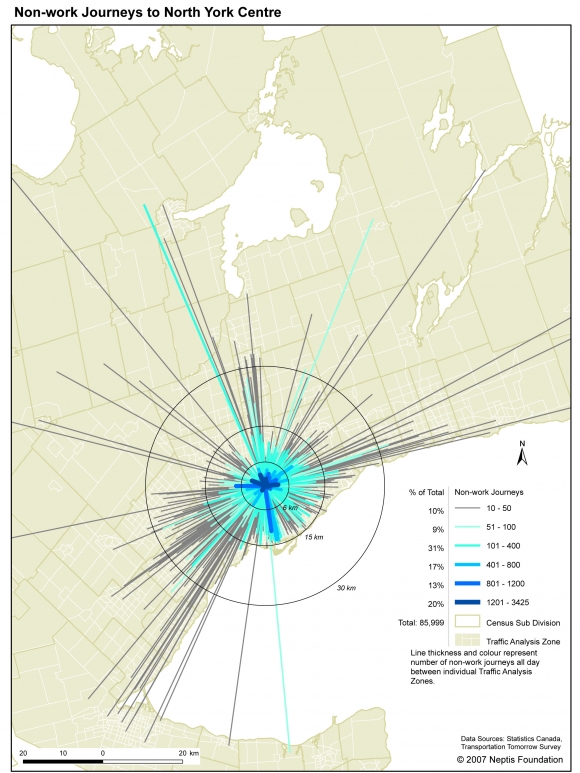
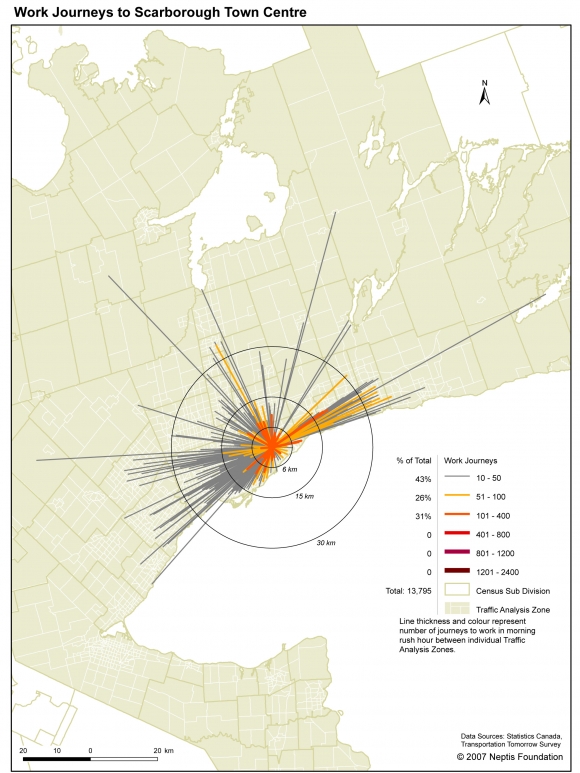
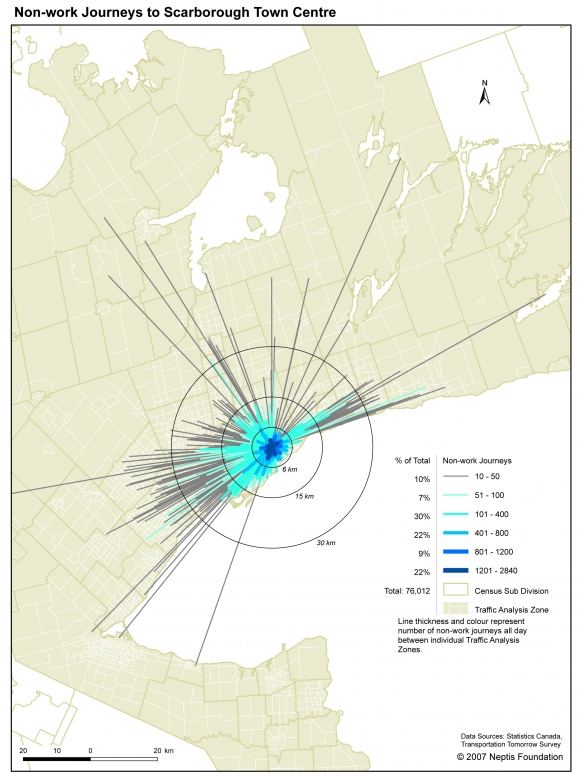
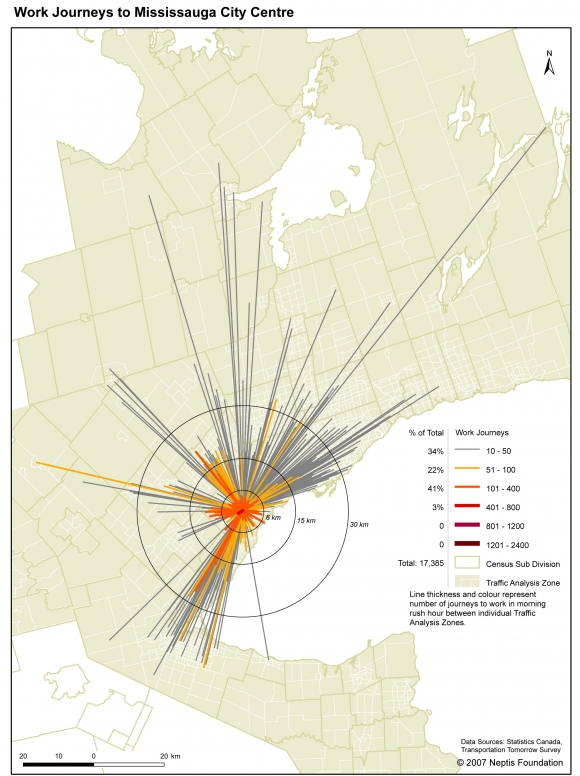
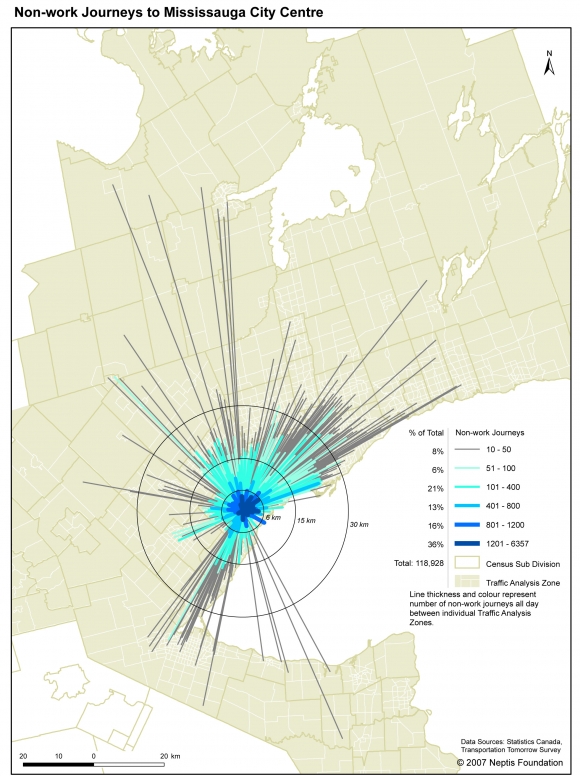
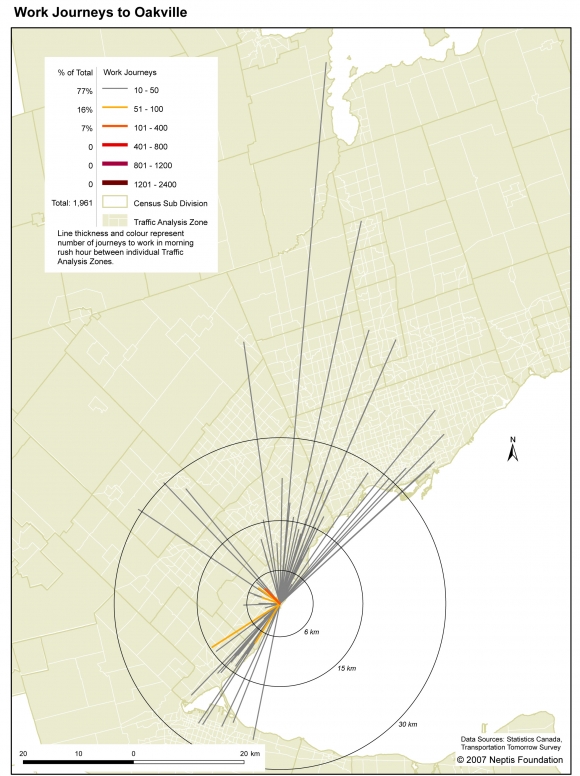
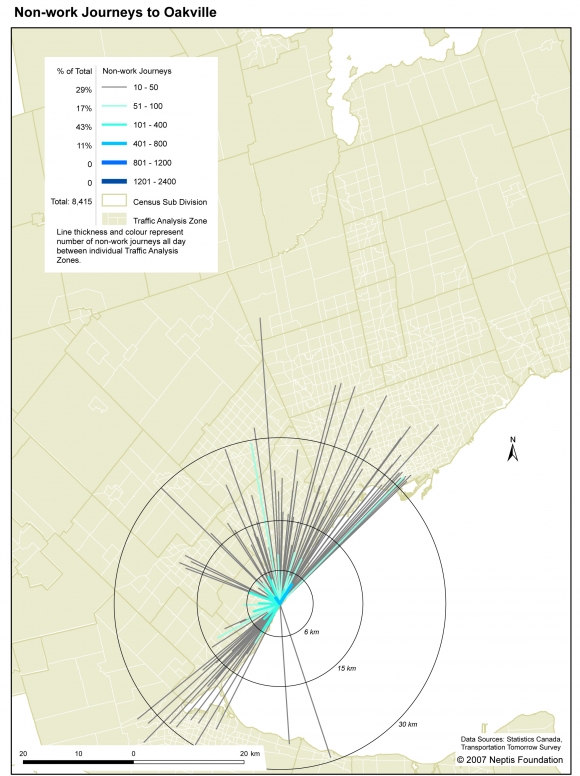
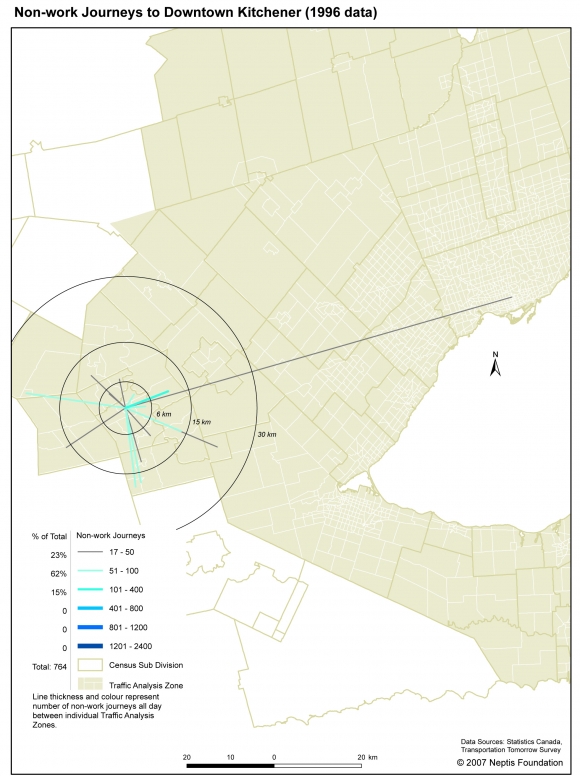
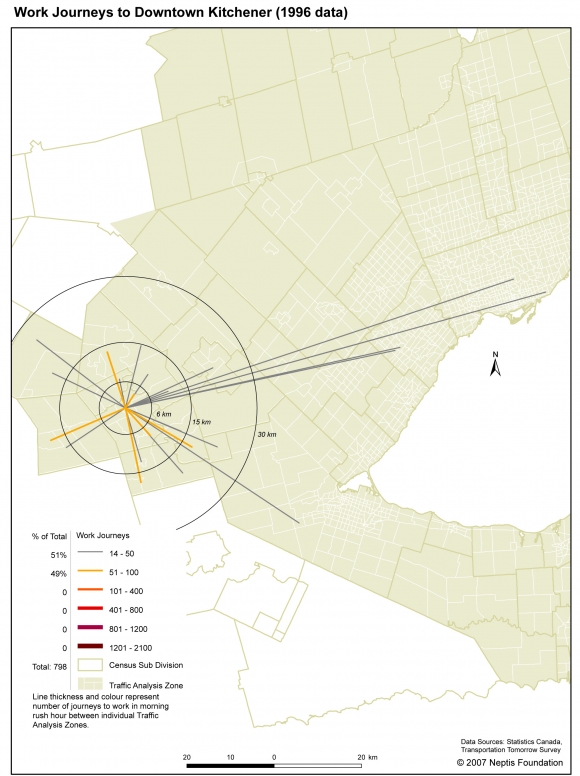
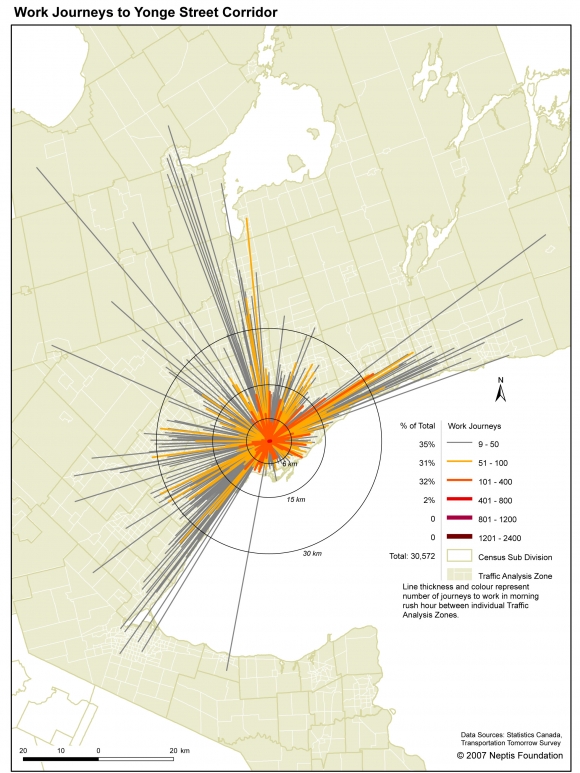
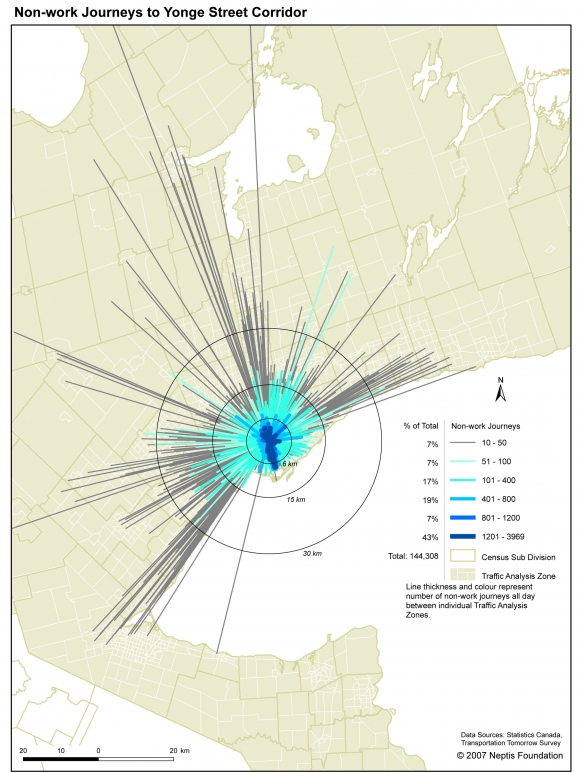
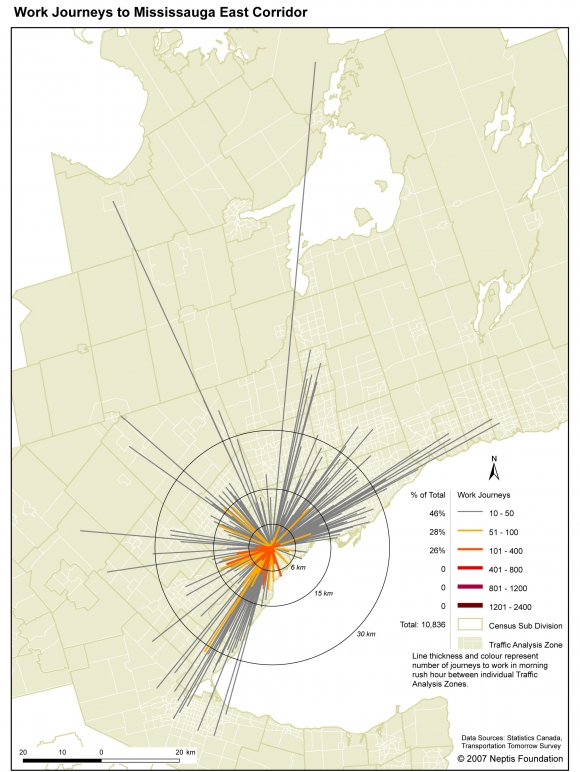
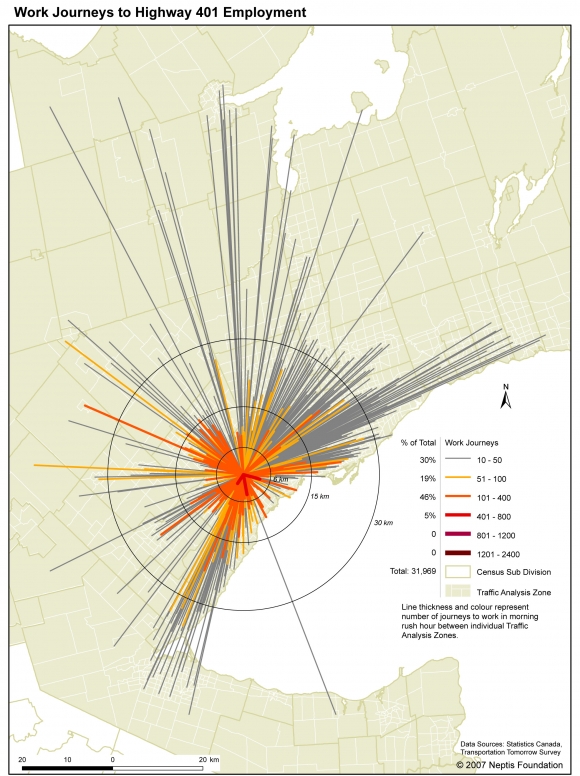
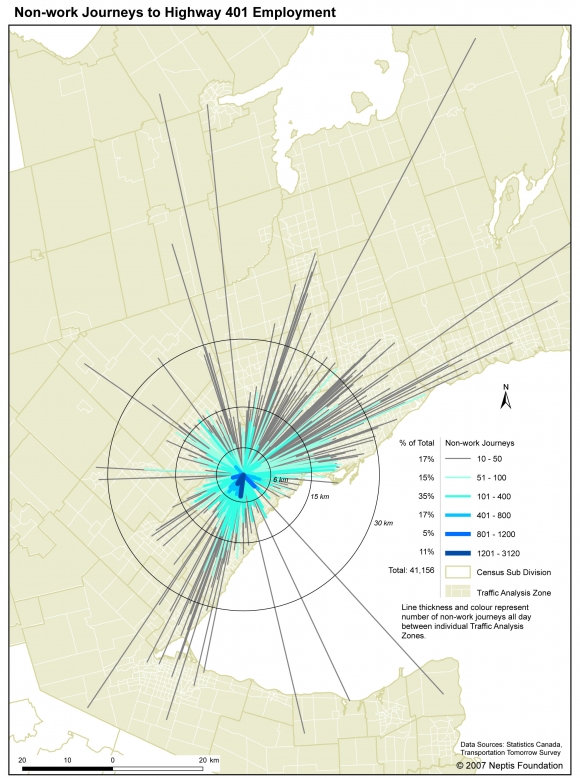
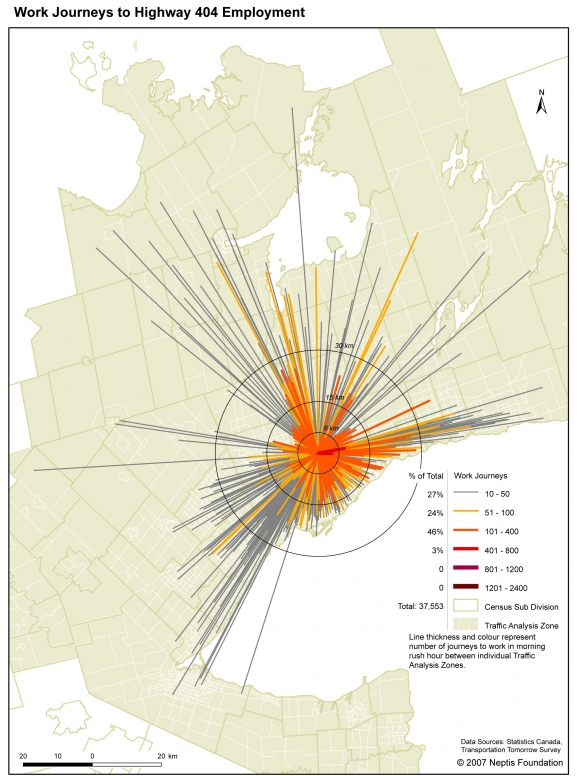
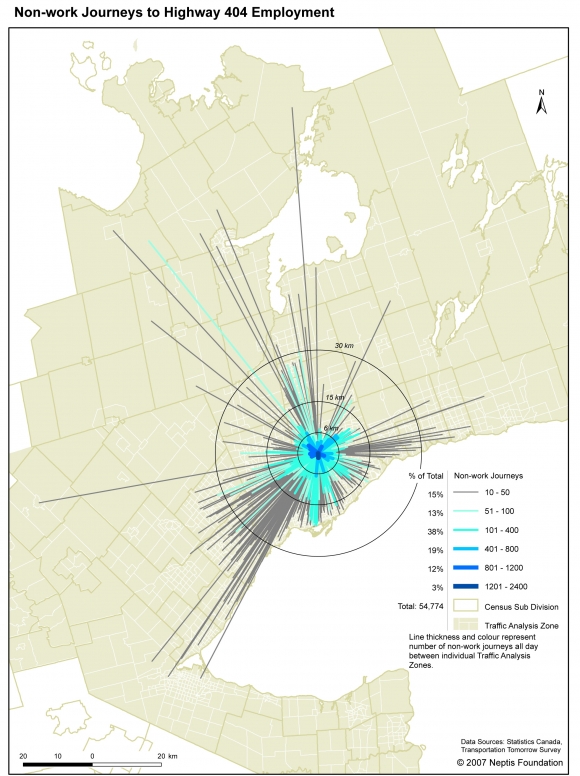
This appendix contains two sets of maps. The first set shows the pattern of work-related trips into each study area. The second shows the pattern of non-work-related trips into each study area. Both illustrate the "sphere of influence" of each study for work- and non-work-related trips.
These maps are created using data from the University of Toronto's Joint Program in Transportation's Transportation Tomorrow Survey. The geography is divided into Traffic Analysis Zones. The lines indicate the number of trips into each study area's TAZs from other zones in the region. The darker and thicker the line, the more trips into the study area from that TAZ. Trips from zones from which fewer than ten trips are made are not shown. Concentric circles indicating distances of 6, 15, and 30 km from the centre of each study area are also shown.
The Transportation Tomorrow Survey sampling was much lower in Waterloo Region than in the remainder of the Greater Toronto Area, which explains the small number of recorded journeys to downtown Kitchener destinations. Traffic analysis zones are also much larger in Waterloo Region than in other GTA urbanized areas.


