Note: This is an updated version of a Brief that looks at the question of serviced land in the City of Brampton. Neptis updated the Brief and its analysis based on new information provided by the City of Brampton. The original Brief has been kept below for the record.
This is the second in a series of Briefs on the land supply for future urban development designated by municipalities across the Greater Golden Horseshoe to accommodate growth to 2031. This Brief examines the question of serviced land in the Greater Toronto and Hamilton Area (GTHA). The first looked at how much land has been built on in the past decade in the GTHA and concluded that only 20% of the total greenfield land supply until 2031 has been built on. Future Briefs will look at the rate of consumption of greenfield lands in Outer Ring municipalities beyond the Greenbelt and other lands that are part of future settlement areas, even though they are not part of the Designated Greenfield Area.
In fall 2016 Neptis published a template intended to help answer the question of just how much serviced but undeveloped land exists across the Greater Golden Horseshoe.
As we noted then, despite claims that the shortage of serviced land has constrained the supply of new homes coming on to the market, thereby causing house prices to rise, finding data - beyond anecdotal evidence - to support this claim is not easy. The province, which has required municipalities since the 1990s to maintain a three-year supply of serviced land at all times, does not collect data on this supply. Municipalities do produce service allocation reports, but no standardized data are available to calculate how much land is serviced in any given year and where it is located.
Therefore, any claims about a shortage of serviced land causing a shortage of housing units, leading to increased house prices, can neither be proven nor refuted.
To develop a template for estimating the supply of serviced land, Neptis used open data sets from the City of Brampton: development applications, registered plans of subdivision, and parkland data. Such data are collected and maintained by all municipalities. These data sets provide a proxy to estimate how much and which parts of the Designated Greenfield Area have municipal water and wastewater pipes and connections to treatment plants, and can therefore be urbanized immediately.
One of the data sets we used from the City of Brampton, however, did not provide a complete picture of the parklands and natural heritage features that cannot be built on. This incomplete data set resulted in an overestimation of the amount of developable land available. Neptis has now updated its analysis based on discussions with the City of Brampton, which has recently released new open data that shows parklands and natural heritage features more clearly.
Our revised estimate is about 910 hectares of serviced land in the City of Brampton that has not yet been developed. If we use updated numbers for March 2017, that number drops to about 900 hectares. Both amounts are less than the 1,200 hectares of serviced-land supply we had previously estimated.
If, however, urbanization in the City of Brampton continues at its current pace, this total supply of serviced land would last about four years, a year less than we had previously estimated. That's still more than the three-year supply that provincial policy requires.
The following map indicates the location of these areas.

The map also distinguishes between employment and residential lands in the total serviced land supply. This level of detail represents a break from our previous practice of releasing gross figures that capture the overall urban footprint, including residential and employment lands as well as parklands and natural heritage features. The previous Brief did not distinguish between employment lands and lands set aside for new homes, a point made to us in discussions with City of Brampton planning staff.
When we removed employment lands from the equation, we were able to determine the amount of land set aside for residential development only: 750 hectares. Updated numbers from March 2017 for development applications and registered plans of subdivisions reduced the residential serviced land supply slightly to 730 hectares. Based on the rate of residential land development in Brampton between 2006 and 2016, the amount is more than a three-year supply of serviced land, which is what the Province requires.

The analysis shows that there is an adequate short-term supply of serviced land in one of the fastest-growing communities in the Greater Toronto and Hamilton Area (GTHA). We used development applications and registered plans of subdivisions to arrive at this conclusion, but municipalities have access to more detailed data internally, which could provide an even clearer picture. Further analyses could include a breakdown of servicing capacity on greenfield land versus intensification areas, as well as information on the staging of development.
We understand that the Regional municipalities in the GTHA are engaged in such an exercise, and we look forward to the release of information that can further refine our analysis and provide more clarity on whether the supply of serviced land is adequate to meet expected demand.
A NOTE ON THE METHOD OF ANALYSIS
Three datasets available through the Brampton open data portal, accessed on October 5, 2016, were of particular interest to Neptis researchers in answering the question of how much serviced land is available in Brampton's Designated Greenfield Area.
1. Development Applications: These identify proposals for land use changes, new construction or additions to buildings, or the creation of new land parcels. In order to focus on plans of subdivision, Neptis researchers selected all polygons in the data set described as "Proposed Draft Plan of Subdivision" that had one of the following forms of approval:
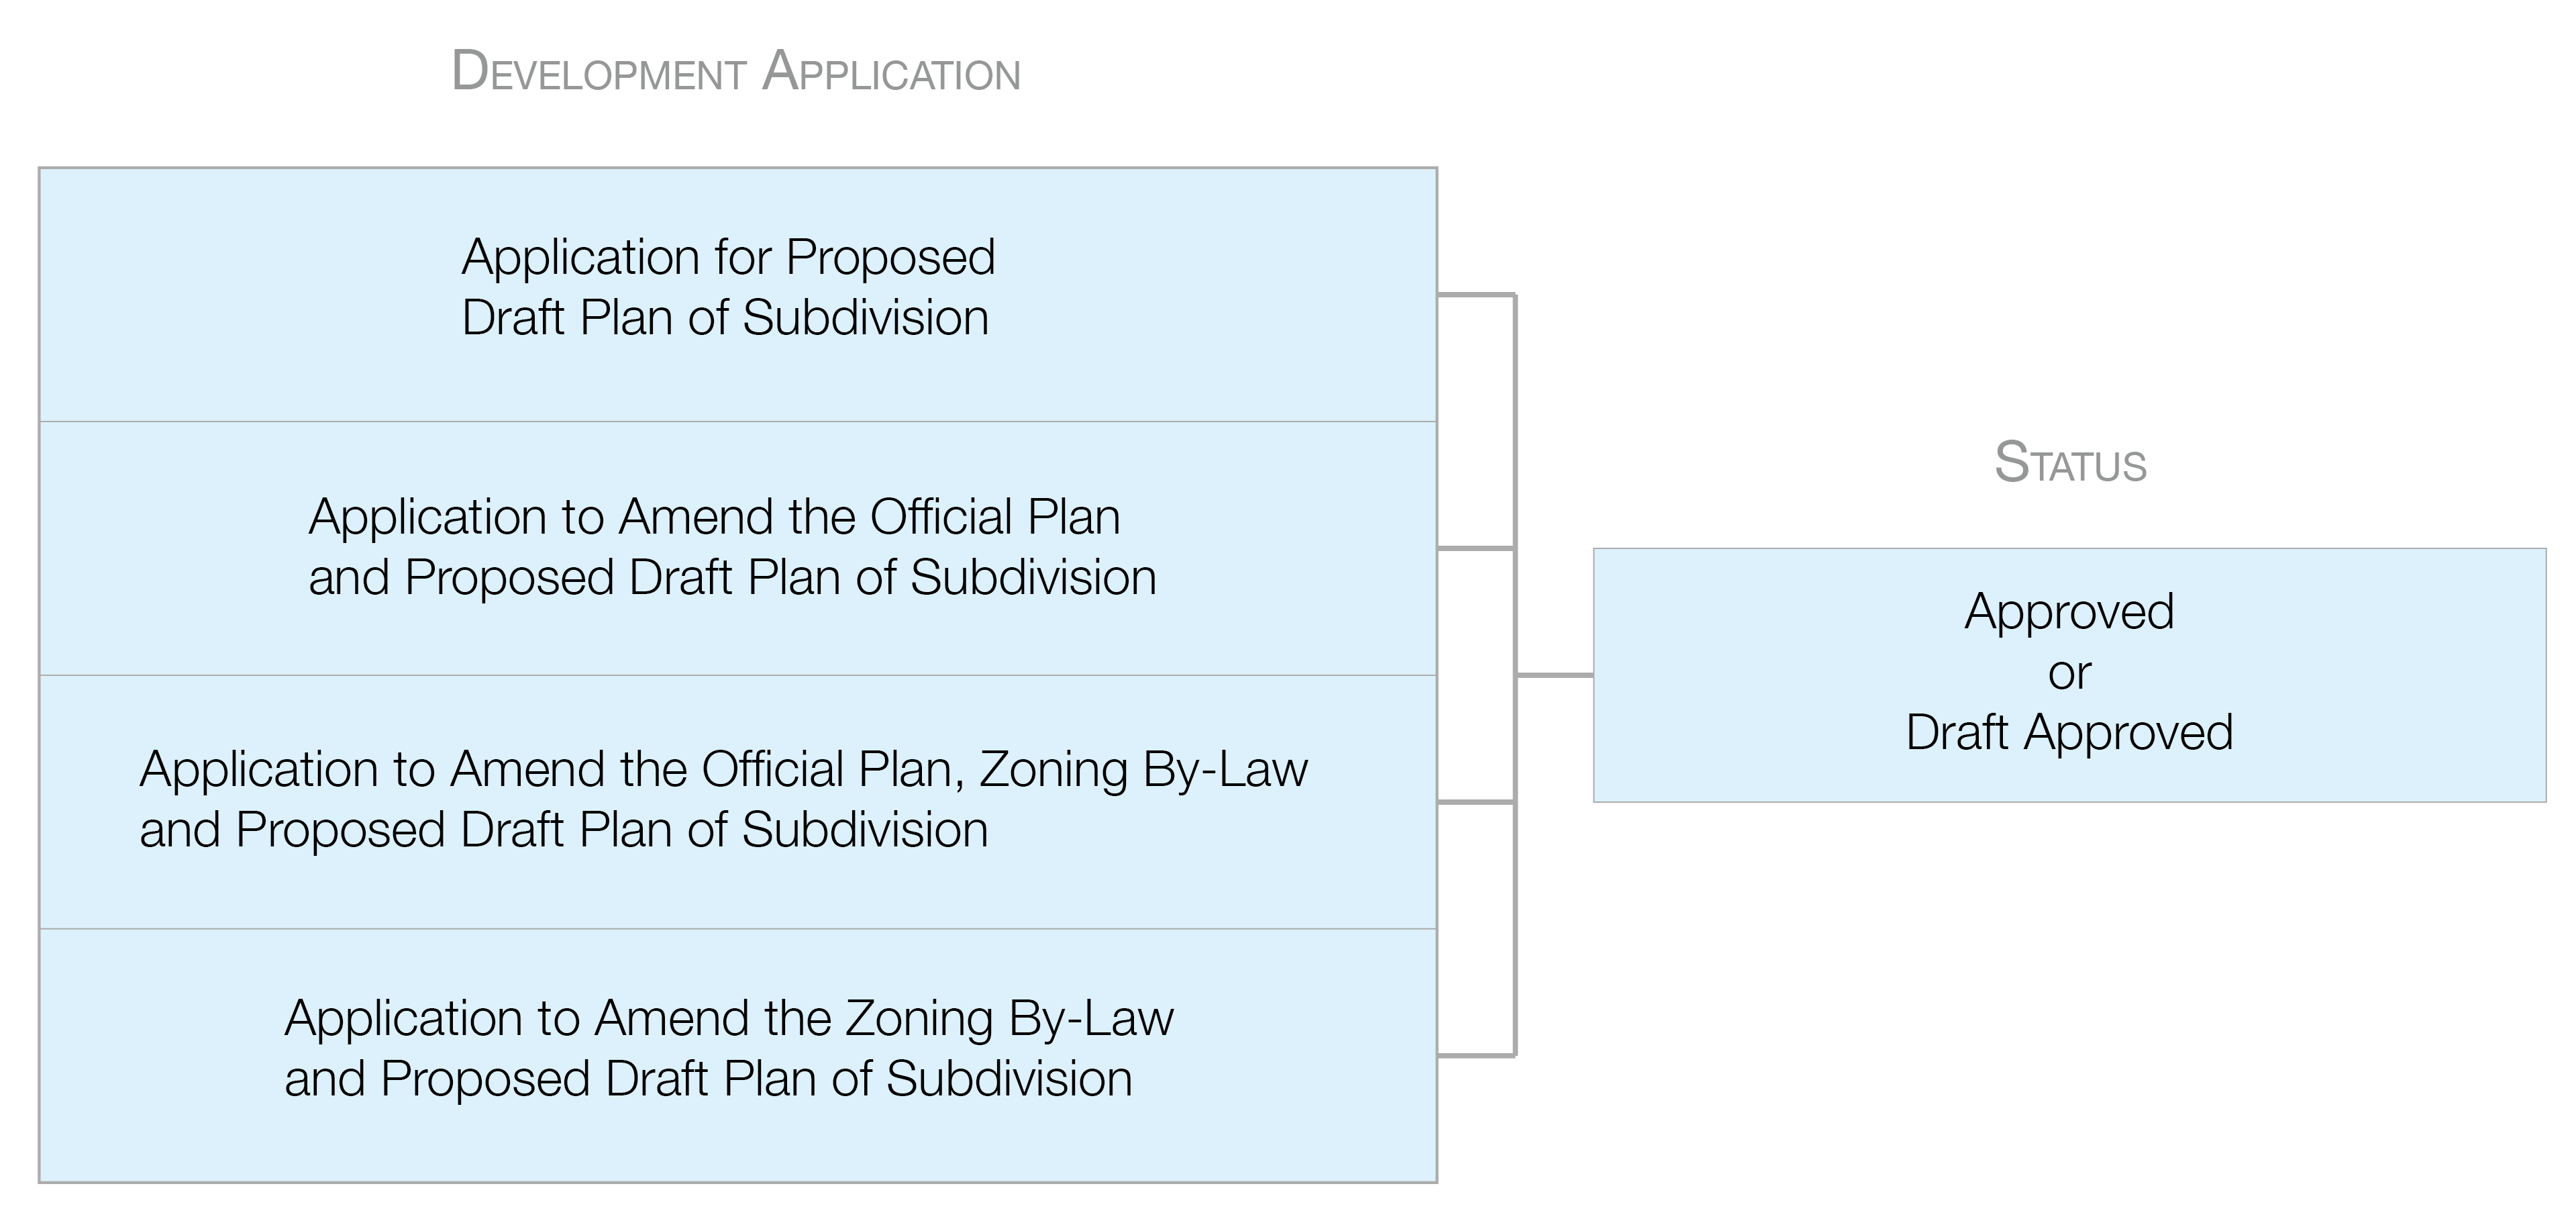
The Ministry of Municipal Affairs notes that draft approvals come with conditions that must be met to obtain final approval and registration. Conditions of draft approval may include such requirements as road widening, naming streets, parkland dedication, or rezoning the area to reflect new uses. In addition, the draft approval may establish a time frame within which the conditions must be satisfied.
Draft approval amounts to a commitment to go ahead with a subdivision, once all conditions have been met. Lots may be offered to buyers for sale after draft approval, but can be sold only after the plan of subdivision has been registered.
2. Registered Plans of Subdivision: This legal document shows the exact surveyed boundaries and dimensions of lots on which houses or other buildings are to be constructed; the location, width, and names of streets; and the sites of any schools or parks. It creates new, separate parcels of land and can be legally used to advertise the sale of lots.
3. Parks: These are tracts of land set aside by the municipality for recreational areas and protected environments, as well as conservation areas. These features were subtracted from the Development Application and Registered Plan of Subdivision areas to calculate the net serviced land available.
The Neptis dataset on land developed between 2006 and 2016 in the Greater Toronto and Hamilton Area comes from an earlier Neptis analysis that was described in the Brief, No shortage of lands for homes in the Greater Toronto and Hamilton Area.
Note: This is the original Brief that we have left published here for the record.
This is the second in a series of Briefs on the land supply for future urban development designated by municipalities across the Greater Golden Horseshoe to accommodate growth to 2031. This Brief examines the question of serviced land in the Greater Toronto and Hamilton Area (GTHA). The first looked at how much land has been built on in the past decade in the GTHA and concluded that only 20% of the total greenfield land supply until 2031 has been built on. Future Briefs will look at the rate of consumption of greenfield lands in Outer Ring municipalities beyond the Greenbelt and other lands that are part of future settlement areas, even though they are not part of the Designated Greenfield Area.
Recently, certain segments of the planning and development community, including some economists, have claimed that a lack of serviced land in the Greater Golden Horseshoe has constrained the supply of new homes coming into the market and caused house prices to rise.
Finding evidence to support this claim is not easy. The province, which has required municipalities since the 1990s to maintain a three-year supply of serviced land at all times, does not collect data on this supply across the region.
The supply of serviced land consists of those parts of the Designated Greenfield Area that have municipal water and wastewater pipes and connections to treatment plants in place, and therefore can be developed immediately. With no regional data available on this part of the land supply, any claim about a shortage of serviced land cannot be proven or refuted.
A new analysis by researchers at the Neptis Foundation that focused on the City of Brampton, however, shows the shortage-of-serviced-land argument to be false in the case of one of the fastest-growing communities in the Greater Toronto and Hamilton Area (GTHA).
The analysis found that Brampton has about 1,200 hectares 900 of serviced land that have not yet been developed. If urbanization in Brampton continues at its current pace, this supply of serviced land could easily last about five years - more than the three-year supply that provincial policy requires.
In the last 10 years, only 2,290 of the 8,740 hectares of designated greenfield in Brampton have been built on; that's 21% of its supply for future urbanization until 2031. Of the remaining designated greenfield supply, about 2,830 hectares in the northwest and northeast areas of the city have been put "on hold" through an Interim Control Bylaw, because the lands fall within the study area for a proposed transportation corridor. That leaves another 2,420 hectares of designated greenfield land available for future development.

The amount of Designated Greenfield Area used up and remaining in Brampton matters in relation to the issue of the alleged relationship between land supply and rising housing prices. A 2015 Neptis report titled Growing Pains showed that Brampton was by far the most important player when it came to adding new housing units and population on greenfields across the GTHA.
Growing Pains contained an analysis of growth patterns in the Vancouver and Toronto regions between 2001 and 2011. The authors found that 20% of dwelling growth on greenfields in the GTHA occurred in Brampton - the highest proportion for any single municipality. Brampton also accounted for 23% of all population growth on greenfields in the GTHA - again, the highest percentage in the GTHA.
A 2016 analysis of land consumption in the GTHA that tracked how much designated greenfield has been built on in the GTHA also revealed that Brampton urbanized the largest amount of designated greenfield land (21% of the GTHA supply) between 2006 and 2016 and has the largest Designated Greenfield Area still available (14% of the GTHA's total DGA).
The current analysis on the supply of serviced land in Brampton was possible because the City of Brampton has made planning information available through a progressive open data policy, allowing the Neptis Foundation (and others) to better understand how much land might be considered serviced. Three data sets from Brampton were used in the analysis:
- Development applications
- Registered plans of subdivision
- Parks
These planning data sets are routinely collected and maintained by municipalities. If the Province asked for and assembled these data sets as part of a monitoring framework for assessing the Growth Plan, everyone would have more clarity on whether the supply of serviced land is adequate to meet expected demand.
Using these data sets, we focused on the Designated Greenfield Area (DGA) to reach our conclusion about the supply of serviced land in Brampton. The DGA is the land set aside by municipalities outside the 2006 built boundary that will accommodate greenfield development until 2031.
First, we identified all registered plans of subdivisions and development applications within the Brampton DGA. Second, we selected only those development applications that were for a plan of subdivision that was approved or draft-approved (meaning that the plan was far along in the planning approvals process). Third, we compared this area of the DGA with our own data set, which identifies land built on between 2006 and 2016. Finally, we subtracted this built-up area from the DGA selection that represented serviced land, resulting in an estimate of the serviced land in Brampton that remains undeveloped as of April 2016.
WHAT IS A REGISTERED PLAN OF SUBDIVISION?A registered plan of subdivision is a legal document that shows the exact surveyed boundaries and dimensions of lots on which houses or other buildings are to be constructed; the location, width, and names of streets; and the sites of any schools or parks. It creates new, separate parcels of land and can be legally used to advertise the sale of lots. Paraphrased from the website of the Ministry of Municipal Affairs and Housing (http://www.mah.gov.on.ca/Page1757.aspx) |
The resulting 1,200 900 hectares for which plans of subdivision have been either registered, approved, or draft-approved provides an estimate of the supply of serviced land, because a plan of subdivision cannot be registered, approved, or draft-approved until servicing is in place.[1] The available serviced land in Brampton is made up of two types of supply:
540360 hectares: Proposed Draft Plan of Subdivision (Status: Approved or Draft-approved);660540 hectares: Registered Plan of Subdivision but not yet built.
The City of Brampton's open data policy has allowed Neptis researchers to shine a light on an issue that has been in the news lately. If similar data were available from other municipalities across the region, we would have a complete picture of the availability of serviced land, rather than unsubstantiated claims that the lack of designated greenfield land, both serviced and unserviced, is to blame for the shortage of new homes and rising housing prices.
A NOTE ON THE METHOD OF ANALYSIS
Three datasets available through the Brampton open data portal, accessed on October 5, 2016, were of particular interest to Neptis researchers in answering the question of how much serviced land is available in Brampton's Designated Greenfield Area.
1. Development Applications: These identify proposals for land use changes, new construction or additions to buildings, or the creation of new land parcels. In order to focus on plans of subdivision, Neptis researchers selected all polygons in the data set described as "Proposed Draft Plan of Subdivision" that had one of the following forms of approval:
The Ministry of Municipal Affairs notes that draft approvals come with conditions that must be met to obtain final approval and registration. Conditions of draft approval may include such requirements as road widening, naming streets, parkland dedication, or rezoning the area to reflect new uses. In addition, the draft approval may establish a time frame within which the conditions must be satisfied.
Draft approval amounts to a commitment to go ahead with a subdivision, once all conditions have been met. Lots may be offered to buyers for sale after draft approval, but can be sold only after the plan of subdivision has been registered.
2. Registered Plans of Subdivision: This legal document shows the exact surveyed boundaries and dimensions of lots on which houses or other buildings are to be constructed; the location, width, and names of streets; and the sites of any schools or parks. It creates new, separate parcels of land and can be legally used to advertise the sale of lots.
3. Parks: These are tracts of land set aside by the municipality for recreational areas and protected environments, as well as conservation areas. These features were subtracted from the Development Application and Registered Plan of Subdivision areas to calculate the net serviced land available.
The Neptis dataset on land developed between 2006 and 2016 in the Greater Toronto and Hamilton Area comes from an earlier Neptis analysis that was described in the Brief, No shortage of lands for homes in the Greater Toronto and Hamilton Area.
[1] On October 4, 2016, staff from the Neptis Foundation met with staff from the Corporate GIS and Development Services Departments at the City of Brampton to confirm that the analysis described in this brief could be considered a proxy for serviced land. The City of Brampton confirmed this to be accurate and suggested that we include the Interim Control Bylaw Area as part of the presentation of our analysis.