Before commencing the analysis, it is important to explain the use of density in planning policy, what the term means and how it is used in this study, and the limitations of density as an indicator of urban form.
Density and planning policy
A century ago planners and social reformers sought to improve the overcrowded industrial city by reducing its density. Since the 1970s, however, higher densities have come to be associated with a variety of indicators of environmental, economic, and social sustainability, including more efficient provision of public services and infrastructure, lower environmental impact, and safer and more dynamic urban districts. (See Fig. 2.) Today, policymakers in North America and Europe are seeking to solve a number of perceived urban problems by increasing the intensity of urban land use.4 Questions remain, however, as to how to operationalize density in planning practice. Traditional zoning by-laws set maximum densities for parcels or districts. Some jurisdictions, including Ontario and the United Kingdom, have turned this approach on its head by experimenting with minimum density thresholds.5
The questions facing planners and policymakers are complex. While higher densities may correlate with certain desired outcomes, can thresholds be defined to indicate which parts of our cities are sufficiently dense, and which parts are not? To what extent does the achievement of desired outcomes depend on factors that are less easily quantifiable, such as architecture, urban design, perceptions, and cultural predispositions? Can observed quantitative and qualitative attributes of existing urban form be translated into standards that can be applied when planning new areas (Jenks & Dempsey 2005:287; Williams 2005)? Put another way, while density may be a useful way of describing existing built form, can be it be used prescriptively in plans, with the expectation that certain outcomes will occur?
Fig. 2: Research on the benefits of higher-density development
Reduced automobile dependence.
It has been found that as dwelling unit density increases above a certain threshold, automobile usage and total distance travelled by car per household decrease in favour of transit, walking, and cycling. See Miller & Shalaby (2000:23-24, 42); Cervero (1998: ch. 3); Newman & Kenworthy (1999: ch. 3); Pushkarev & Zupan (1977: ch. 2).
Increased safety, social cohesion, commercial dynamism, and pedestrian access to amenities.
Although much depends on design and other factors, increased intensity of human activity and 24-hour use of public spaces can promote safer urban environments through "eyes on the street" and more economically dynamic retail environments (Jacobs 1961). Higher residential population densities can, if appropriately configured, create a "critical mass" for pedestrian access to parks, community facilities such as libraries and schools, and shopping. See Churchman (1999:398-99).
Less consumption of rural land and greater environmental sustainability.
All things being equal, the higher the density of new development, the lower the amount of rural land converted to urban use and the greater the opportunities to preserve agricultural land and environmentally sensitive areas.6 At the same time, particular patterns of higher-density development have been shown to make less impact on the natural environment (Berke et al. 2003; Gordon & Tamminga 2002).
More efficient infrastructure use at lower cost.
More compact urban form has been shown to reduce capital costs for infrastructure. While the cost of central facilities -- water, sewer, and electricity generation plants, for example -- are the same no matter how the population is arranged, the cost of constructing distribution systems such as pipes and wires will be lower if they cover shorter distances (IBI Group 1990).7
Expressing density
Density can be measured and expressed in a variety of ways, each of which is appropriate in different situations. There is no consensus on how to measure density and, by extension, how to use density thresholds in plans and policies. A 1995 survey found that there were almost as many definitions of density in use in plans in the Greater Toronto Area as there were municipalities (Lehman & Associates et al. 1995:8-10). The result has been some degree of confusion in policy formulation and in the broader public discussion on density and intensification in Ontario and, indeed, elsewhere (Hitchcock 1994:4).
In all cases, density is expressed as a ratio in which the numerator is a quantity of human activity -- residents, jobs, or built form -- and the denominator represents a given land base. Typically, density is expressed in terms of a single unit of land area -- for example, dwelling units per hectare or population per square kilometre.
The choice of numerator
The choice of numerator depends on the phenomenon under investigation. Population density is appropriate in situations where people are the object of study or regulation. For example, since it is people rather than households who make travel decisions, population density is an appropriate indicator of potential transit use. Population is also a more appropriate basis for defining catchment areas for infrastructure that serves individuals, such as hospitals and schools. Buildings, however, occupy land and are serviced by hard infrastructure. For this reason, dwelling unit density is a more appropriate indicator of residential land consumption than population density. Dwelling unit density is also used in the provision of infrastructure services such as water and sewer pipes, roads, and electricity to buildings. Density of floor area -- expressed as floor space index (FSI) or floor area ratio (FAR) -- is another common indicator of residential and non-residential built form typically employed at the parcel scale.
Residential uses comprise only part of the urban land area. The density of employment is commonly measured in terms of employees or workplace floor area. Determining the number of jobs in a given area is not as straightforward as measuring population and dwelling units. First, jobs themselves are more volatile than the residential population, since the number of employees in any business may increase or decrease at any time. Second, employment can take many forms, each of which has very different land, built form, and infrastructure requirements. An office worker, for example, occupies considerably less space than a warehouse worker, resulting in a higher employment density for office employment.
At the same time, separate density numbers for residents and jobs become less useful the more land uses are mixed. In some jurisdictions, a "functional population" is calculated to estimate public facility requirements by weighting residents two-thirds and workers one-third (Nelson & Nicholas 1992:45-58). Nelson proposes a more complex calculation that accounts for the number of hours a resident, worker, or visitor is likely to be present within the area (Nelson 2004:61-62).
In the Toronto region, a combined density number that sums residential population and employment has been used in provincial and local plans and policies. The earliest known use of a combined density was in the Municipality of Metropolitan Toronto's Guidelines for the Reurbanisation of Metro Toronto (BLG 1991a). Lehman and Associates et al. subsequently recommended that "[e]ach Secondary Plan District [of 300 hectares or more] should have as its objective the achievement of 50 residents and/or employees per hectare" (1995:29), a value repeated in the present Growth Plan, though applied to a larger land area.
Land bases used in this study
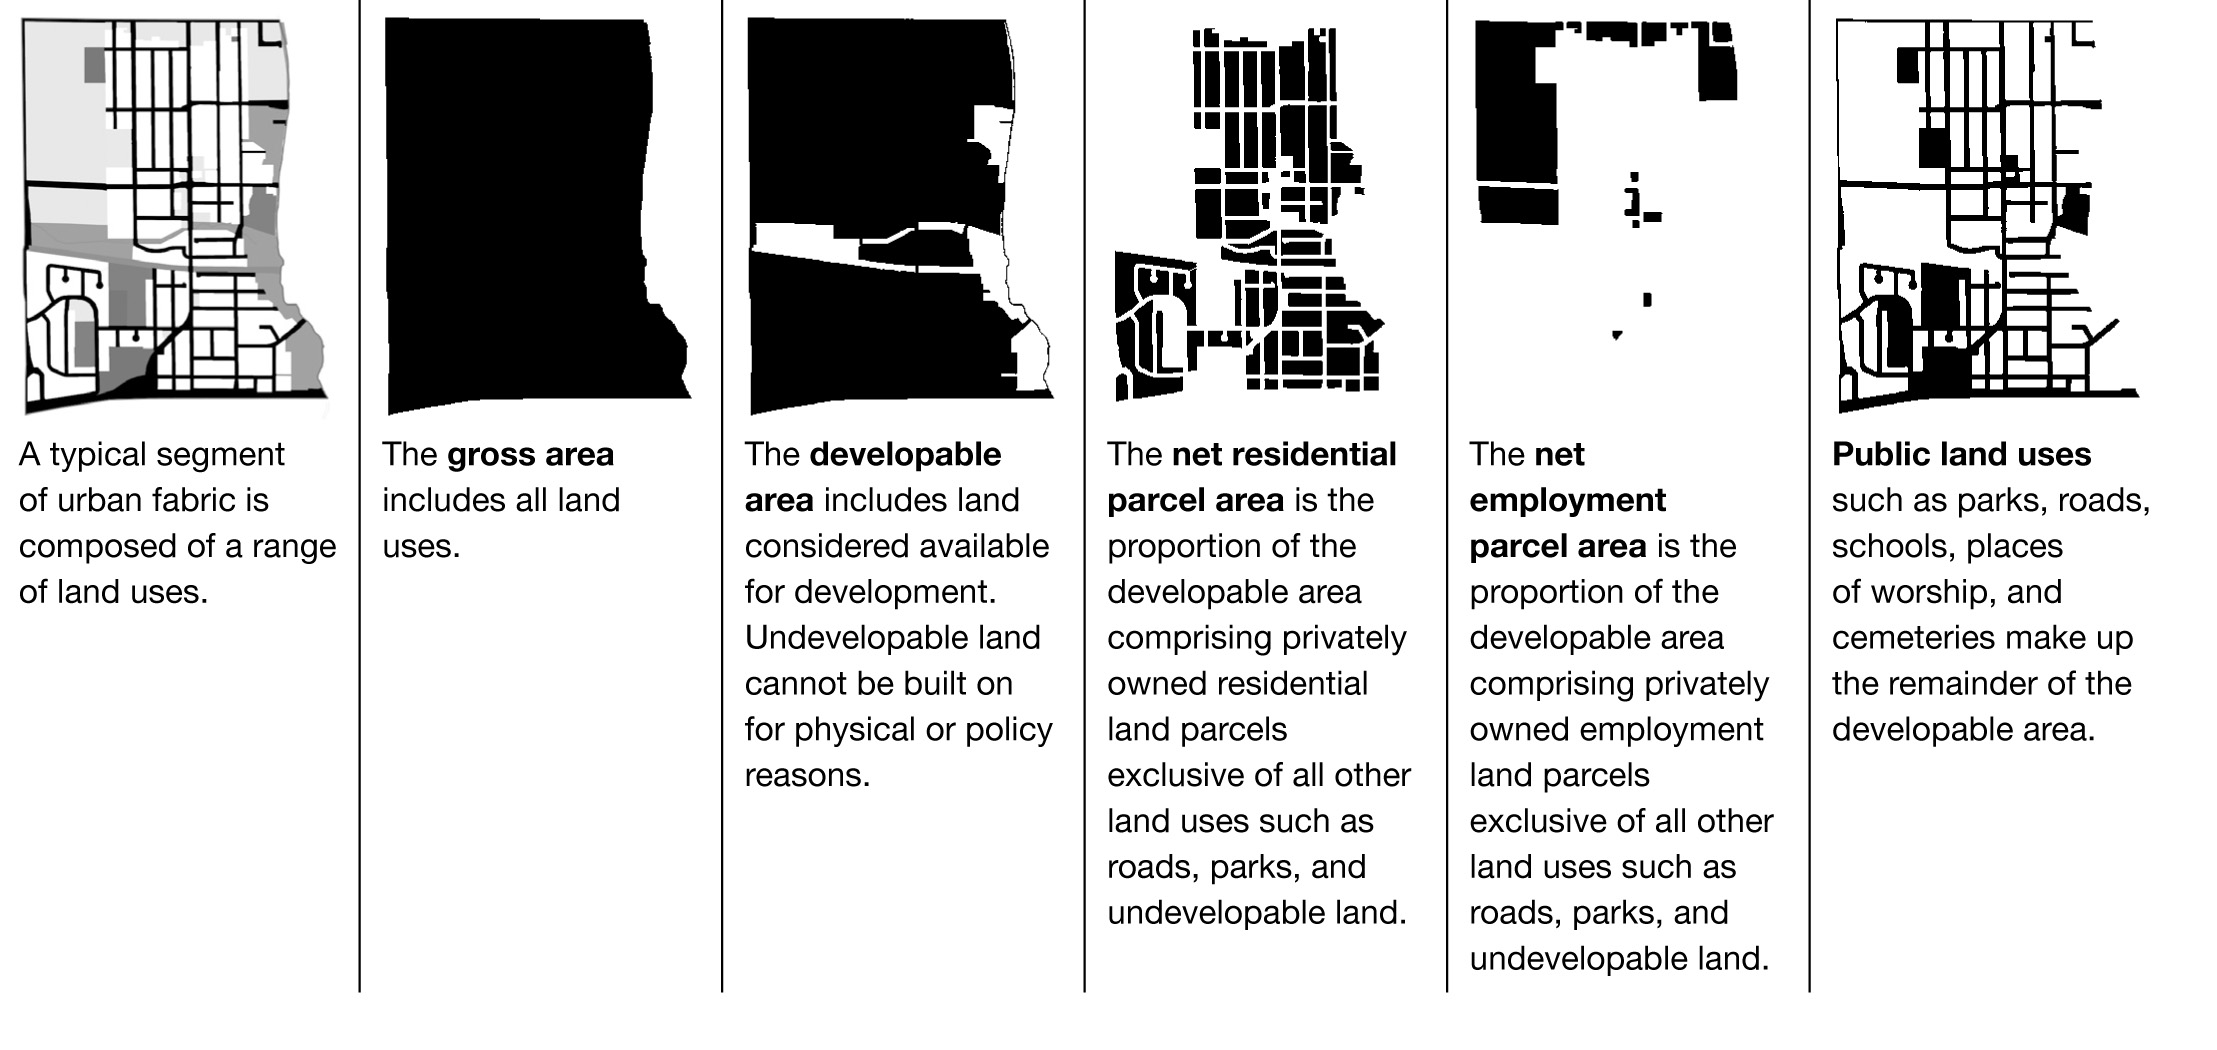
In this study, density is calculated on three land bases:
Gross density includes all land in the study area.
Developable area density excludes lands protected for environmental reasons or undevelopable hazard areas such as flood plains, or utility, rail, and limited-access highway corridors.
Net parcel area density is calculated on the portion of the developable area comprising privately owned residential and employment land parcels, exclusive of all other land uses.
Section 2 separately considers the attributes of public land uses such as parks, schools, rights-of-way, places of worship, and cemeteries. The developable land area is an approximation of the land base on which the Growth Plan's minimum density target for greenfield land will be assessed. In the land use analysis in Section 2, highway, rail, and utility corridors are excluded from the developable land base. The Growth Plan includes these in the land base to which the minimum density target is applied: the designated greenfield areas of upper- and single-tier municipalities. Excluding these corridors, which are present in some Section 2 study areas but not others, was deemed necessary to avoid distortion of density and other values pertaining to the developable area land base. (See Figs. 3 and 1.)
Fig. 3: Land base definitions
Inclusiveness and scale
In general, "gross" measures of density include more land uses in the land base, while "net" densities exclude certain land uses. Buildings, people, and physical features are not distributed evenly across the landscape. The presence of a large apartment building or park in a small land base may produce a density number much higher or lower than is typical of the rest of the land base. Density numbers express the average amount of activity over a given territory and do not give insight into variations in density within the land base on which they are calculated. Density numbers are therefore sensitive to the land use categories or specific features included in or excluded from the land base.
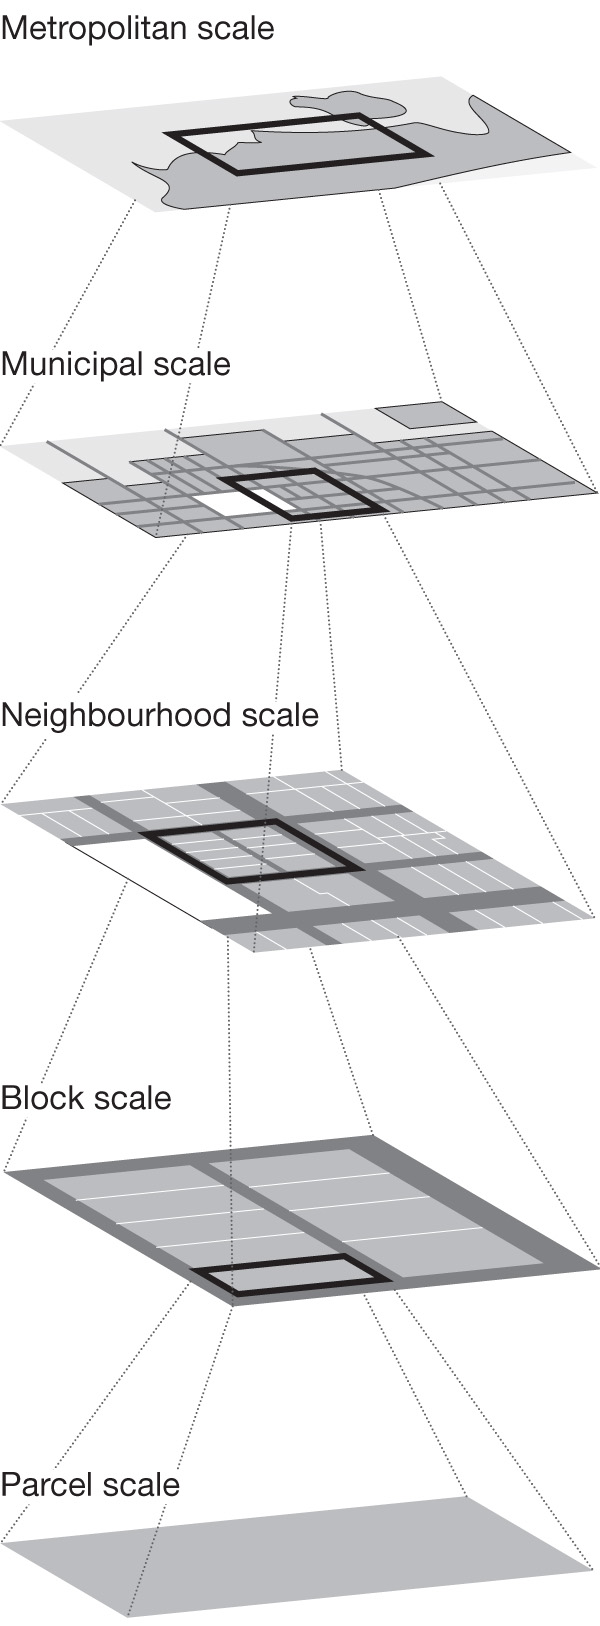
The uneven distribution of uses across the landscape means that inclusiveness is related to geographic scale. Features such as bodies of water, floodplains, environmentally protected land, and corridors reserved for expressways, electricity transmission lines, and railways are better studied at a regional rather than district scale. The size of the land base on which density is calculated determines the extent to which these large-scale features are included. (See Fig. 4.) Density comparisons are most valid when the scale and degree of inclusiveness of the cases under consideration are similar. Technically, this is known as the "modifiable areal unit problem." For a more detailed discussion of this problem, see Appendix B.
Fig. 4: Scales of analysis
The limits of density as an indicator of urban form
Hitchcock notes that "density as employed in land use planning and related applications appears to be a simple concept, but the complex reality to which it is applied -- the three-dimensional city -- cannot be fully captured by any given density measure" (1994:1). While buildings and other structures are static, the way people move through space is not. People live, work, consume, and relax in different locations and travel between them in a variety of ways. These spatial relationships and flows are complex and operate at many scales, from the metropolitan down to the neighbourhood, block, and parcel level and, as a result, are more complex than can be expressed by a single number.
While density can usefully describe existing urban form in quantitative terms, its ability to capture qualitative characteristics is limited. Lehman and Associates et al. (1995) acknowledge that while higher "density is a key to achieving the benefits of a more compact urban form," (6) it is a "somewhat meaningless measure of the quality of an urban environment because density is a concept that is given shape through urban design and, ultimately, the built form that is produced" (5). As Rapoport (1975:134) puts it, "a concept of density based on a simple ratio model does not seem adequate to predict either behavioural or subjective consequences, and the experience of density must go beyond such ratios." In the Study of the Reurbanisation of Metro Toronto, Berridge Lewinberg Greenberg Ltd. go further, noting that "the 'livability' of high density environments depends on many factors, [including] the design of buildings and residential environments; the ability to exercise choice in housing and wield control over one's living environment; culture; socio-economic status; and access to amenities and community resources" (BLG 1991b:95). Distinguishing between perceived and physical density, Alexander notes that "density is a complex concept involving the interaction of perceptions with the concrete realities of the built environment" (1993:182-83). The perception and experience of the built environment, while related to measurable characteristics, is shaped by individual cognitive and socio-cultural factors. It is possible to have "good" and "bad" urban environments at any density.
There have been several attempts to capture a wider range of characteristics of urban form in quantitative terms. Galster et al. (2001), for example, delineate several "dimensions" of land use patterns at the metropolitan scale: density, continuity, region- and local-level concentration of development, and the degree to which population and employment are concentrated in the downtown core. Cutsinger et al. (2005) expanded this work, adding variables for mixture of residential and employment uses and the relative proximity of people and jobs at the metropolitan regional scale. In both studies, the authors proposed combining a metropolitan region's scores for these variables into a single "sprawl index."
At the neighbourhood scale, both Weston (2002) and Knaap et al. (2005) have developed a series of variables describing street network design, land use intensity, and land use mix. Criterion Planners' INDEX model (2004) operates at multiple scales and incorporates 70 land use, built form, environmental, and travel variables into a visualization and forecasting tool.
In the early 1970s, the American Federal Housing Administration (1971) developed a Land Use Intensity Rating (LUIR) that combined indices of density, open space, living space, recreational space, and parking into a single interval scale. Due to flawed or overly rigid underlying assumptions, however, the LUIR was not adopted by planning practitioners (Alexander 1993:185). Multivariate descriptions of urban form have yet to find widespread use in land use plans.
However imperfect it may be, density remains a commonly used measurement in land use planning because it is simple to calculate and express.
Notes
4. Contrary perspectives are provided by those who argue that the environmental and transportation arguments in favour of higher density have not been proven, as well as demand-driven arguments based on surveys of consumer preference for lower-density housing. See Churchman (1999); Gordon & Richardson (1997); Neuman (2005); and Troy (1996). For an interesting commentary on the shift in focus from anti-congestion to anti-sprawl, see Sloane (2006).
5. Recent amendments to the Ontario Planning Act (Planning and Conservation Land Statute Law Amendment Act, S.O. 2006, c. 23 [Bill 51]) permit planning authorities to incorporate minimum densities and heights into zoning by-laws. Local planning authorities in rapidly growing parts of the United Kingdom are required to consult the national government before permitting individual development projects of less than 30 dwelling units per hectare (Dept. of Communities and Local Government 2006: s. 47).
6. IBI Group (1993) found that four times as much land is consumed per resident and seven times as much land per worker in recent suburbs compared to the central city (quoted in Blais 2000:37).
7. A follow-up study prepared for the GTA Task Force found that the total capital cost of accommodating 25 years of growth could be reduced by as much as 16% by adopting a more compact urban form (IBI Group 1995; Blais 1995:9-18, 40). In a survey of per-capita levels of public expenditure in 12 policy areas in 283 metropolitan counties in the United States, Carruthers and Ulfarsson (2003:503-22) found that as overall density increases, costs go down. De Sousa (2002:251-80) found that, including potential tax revenues, brownfield redevelopment would result in a net public benefit relative to greenfield development. The Real Estate Research Corporation (1974) and Burchell et al. (1998) found that capital investment for "sprawl" is higher than for higher-density urban form. CMHC (1997) found that over a 75-year life cycle, capital investment and maintenance costs for infrastructure are lower for more compact forms of development. In a model of urbanization in the Pearl River delta in China, Yeh (2004) found that more compact development would substantially reduce the amount of agricultural land consumed, land development and infrastructure costs, and energy use.