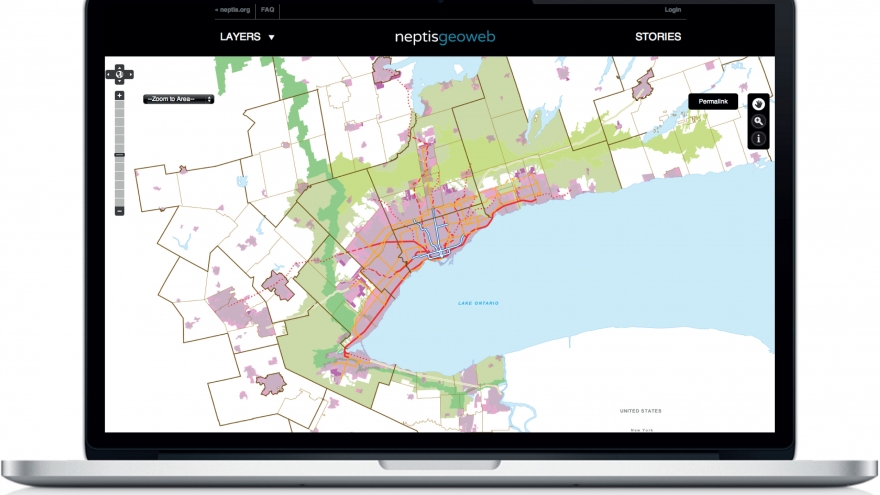
If you've ever wanted to visualize how the Greater Toronto Region is going to develop in the coming decades, look no further than the Neptis Geoweb.
Neptis drew on information from more than a hundred provincial and municipal documents and its own data archive to create the Geoweb. This information has never before been available in one place and some of it is not readily available online. The results show not just how we've grown in the past, but exactly where land has been set aside for future urbanization.
The Neptis Geoweb, launched in beta format this week, is, however, much more than a map of growth.
What is the Neptis Geoweb?
A Geoweb has been described as an "integrative, discoverable collection of geographically related web services and data that spans multiple jurisdictions and geographic regions.[1]"
Our Geoweb integrates mapping and statistics to inform discussions around complex issues and convey information about patterns of regional growth and change. Users can also interact with 43 layers of information on five different base maps. The layers include historical urban boundaries, agricultural areas, provincially protected zones and even Metrolinx's Big Move transportation plans.
As a user, you will have the freedom to play with these data layers from the various actors that influence the Toronto region's future form and see for yourself how different plans and proposals interconnect - or don't.
It's about synthesis, it's about juxtaposition, and it's about revelation, because when multiple layers of information are available in one place, insights can be found.
In addition, the Neptis Geoweb can tell map-based stories and start place-based conversations, as well as allowing users to create their own maps, comment on map stories, and share links to customized maps.
To start the process, we have created a few "stories" that use selected maps to show changes over time. Examples include--how the definition of the "region" has changed over time, how and where the urbanized area will grow, and how and where land has been conserved.
The result is an interactive web-based visualization of past, present and future development patterns in the Greater Toronto Region.
Why did Neptis create the Neptis Geoweb?
The Neptis Geoweb was created to help residents, researchers and decision makers better understand the often invisible forces that shape our urban and rural environments - and by extension, our lives.
Helping the public "see" the big picture of how and where growth occurs enhances awareness of regional planning issues and supports better decision-making.
Because it's a beta launch of an open-source software project with many different data sets, we realize things may not be perfect, but more importantly, we are committed to making improvements. That's where we are counting on you, the community of users, to correct any errors, build upon our work, and suggest enhancements. And we intend to continue on this journey in map-based visual engagement by improving and upgrading the Geoweb over time.
We're already working on plans for Phase 2, which will bring better navigability, more information and additional analytical tools.
Who is behind the Neptis Geoweb?
This release is a product of the Neptis Foundation.
We are, however, connected to and will tap into the expertise provided by a five-year research project involving a network of researchers and several non-academic partners, colloquially known as GeoThink. The network is supported by a SSHRC partnership grant officially called "How the Geospatial Web 2.0 is Reshaping Government-Citizen Interactions."
Our local partner is Ryerson University's Geography Department, which is hosting the Neptis Geoweb. Improvements to the geoweb will stem from Geography Professor Claus Rinner, Planning Professor Pamela Robinson and their students who will critique and test the Neptis Geoweb in the "sandbox" setting of the classroom as a teaching tool.
So dive in, read our stories, play with the data, create your own maps, give us suggestions on how we can make it better and most important of all, engage visually while you learn more about the region.


